Download
1 / 9
90 likes | 171 Vues
Explore the challenges and opportunities for small producers in the expanding carbon market. Learn about the growth of project-based initiatives, limitations faced, and the potential of programmatic CDM. Discover how national policies and programmatic approaches can enhance sustainability and financial viability for small-scale projects. Stay informed with key messages and contacts for further engagement.

E N D
STRICTLY PRIVATE & CONFIDENTIAL The Carbon Market and Small Producers 18 July, 2007
State of the Carbon Market • The Carbon Market grew to an estimated US$30 billion in 2006 (three times greater than the previous year) • Project-based (JI/CDM) grew to a value of US$5 billion in 2006 • 450 MtCO2e from CDM in 2006 • Average price of CERs in 2006 was of US$10.90 (majority of transaction in the range of US$8-14) • A key indicator of interest in aligned and closely related fields is the record US$70.9 billion in clean technology investment in 2006.
At the end of 2005 there were 39 registered projects, by July 2007 over 720 projects have been registered and 900 are in the pipeline. Private sector driven Low cost emission reductions Reduced emissions from single sources with lots of emissions Limited Scope Sectors Scale No structural change Geographic distribution New Metrologies (additionality and baseline setting) Projects with high sustainable development value are hard to finance High transaction costs Clean Development Mechanism (CDM) Achievements Limitations/Constrains
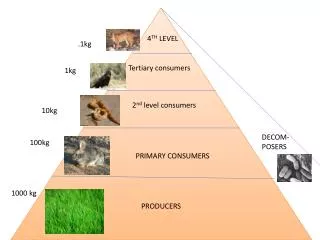
Small-scale CDM Methodologies • Type I Renewable Energy (15 MW per year) • Type II Energy Efficiency (60 GWH per year) • Type III (60 000 tCO2e) • Renewable Energy Methodologies • I. A Electricity generation by the user.- Household or uses that do not have a grid connection • I. B Mechanic Energy for the User.- on site use of technology that provides mechanical energy • I. C Thermal energy for the user with or without electricity • I. D Grid connected renewable electricity generation • Methodologies Applicable to Agricultural Activities • II.F Energy Efficiency and fuel switching measures for agricultural facilities and activities • III. D Methane Recovery in agriculture and agro industrial facilities • III. E Avoidance of methane production from decay of biomass through controlled combustion • III. F Avoidance of methane production from decay of biomass through composting
CDM has not yet delivered renewables • Renewable (on and off grid) have faced a number of barriers, explaining their marginalised position in the CDM • Carbon credits derived from renewable energy saw their share increasing by 50% in 2006, at 16% compared to 10% in 2005, buoyed mainly by China’s decision to identify these alternative sources of energy as a priority. • Renewable development has more to do with national policy than the extra monetary incentive provided by CDM World Bank, 2006, State of the Carbon Markets
Small Volume of CERs compared with high capital costs Therefore at a comparative disadvantage with cheaper projects that produce more CERs Transaction costs prohibitively high when compared to CER volume Local host country regulation Tariffs and connection fees mean that the extra revenue from CERs does not make projects financially viable Other ‘low hanging fruit’ Industrial gasses represent cheaper, easier to get to CERs. Small Scale Methodologies – AMS I.D. Reducing CDM related transaction costs doesn’t solve the economic and implementation barriers facing the deployment of clean energy projects Eligibility limit of 15MW for a small-scale CDM project activity Over 200 projects registered. Barriers Facing Renewables
Programmatic CDM • Programme of activities (PoA) Can be used to promote/implement policy/measure or state goal • Voluntary coordinated action • A mandatory policy/regulation would be systematically not enforced and that non-compliance with those requirements is widespread in the country/region • Lead to a greater level of enforcement of an existing mandatory policy/regulation • CPA – CDM programme activity – a project activity under a programme of activities • PoA cannot exceed 28 years • One coordinating entity • Local, regional, national or multinational • Apply the same methodology or technology • Appropriate boundary, avoid double counting, leakage, additionality, establishment of baseline emission reductions are real measurable and verifiable.
Summary of Key Messages • Project based approach is limited in scope • National policies are needed to incentivice carbon finance • Programmatic CDM will require more complex financial structure to deliver upfront investment • Programmatic CDM will involve a wide range of stakeholders and represents coordination challenges • Pilot projects will be essential to gather data, build capacity, test streamlined approaches and prepare governments for new approaches.
Contact Climate Change Capital CCC Head Office Climate Change Capital 49 Grosvenor Street London W1K 3HP United Kingdom Tel: +44 (0)20 7290 7040 Fax: +44 (0)20 7290 7041 www.climatechangecapital.com