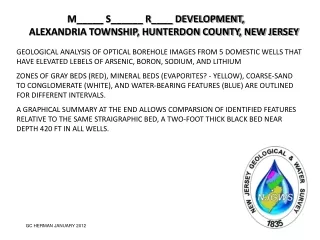
Download
1 / 18
180 likes | 193 Vues
This study explores well logging and gamma ray analysis to characterize the geological formations in Heron Glen Golf Course in Raritan Township, NJ. The data collected from the wells and the interpretation of the gamma ray logs provide insight into the subsurface structure and potential groundwater resources.

E N D
Structural Map Exercise 1 Heron Glen Golf Course, Hunterdon County, New Jersey Source: Maps and figures adapted from Rider/PDFs/NJGS_Bulletin_77_Appendixes_1-4.pdfhttp://en.wikipedia.org/wiki/Well_logginghttp://en.wikipedia.org/wiki/Gamma_ray_logging Rider Structural Geology 310 2011 GCHERMAN
Well Logging Well logging, also known as borehole logging is the practice of making a detailed record (a well log) of the geologic formations penetrated by a borehole. The log may be based either on visual inspection of samples brought to the surface (geological logs) or on physical measurements made by instruments lowered into the hole (geophysical logs). Well logging can be done during any phase of a well's history; drilling, completing, producing and abandoning. Well logging is done in boreholes drilled for the oil and gas, groundwater, minerals, geothermal, and for environmental and geotechnical studies.
Gamma Rays and Gamma Logs 0 CPS 1000 Gamma radiation (or gamma rays) is the highest form of electromagnetic radiation with high frequency (very short wavelength) that are naturally produced in the universe by very high energy events (such as supernovas), and they naturally on Earth by decay of high energy states in atomic nuclei (gamma decay). Gamma ray logging is a method of measuring naturally occurring gamma radiation to characterize the rock or sediment in a borehole. It is commonly used in mineral exploration, water-well drilling, and formation evaluation in oil and gas well drilling. Three elements and their decay chains are responsible for the radiation emitted by rock: potassium, thorium and uranium. Shales often contain potassium as part of their clay content, and tend to absorb uranium and thorium as well. A common gamma-ray log records the total radiation and cannot distinguish between the radioactive elements. Because different types of rock emit different amounts and different spectra of natural gamma radiation, gamma logs are used to differentiate and correlate strata in the subsurface. This difference in radioactivity between shales and sandstones/carbonate rocks allows the gamma tool to distinguish between shales and non-shales.
Background A hydrogeological framework study of the the Brunswick bedrock aquifer was conducted in the vicinity of the Heron Glen Golf Course in Raritan Twp., Hunterdon County in 2003 by the NJ Geological Survey to assist the county in evaluating the groundwater potential for it’s irrigation and supply wells. Outcrops in the vicinity were mapped and geophysical logs were run in 3 out of 6 wells located on site. Borehole data were collected in two monitoring wells and a domestic-supply well for the golf course. Optical televiewer, VHS borehole video, and fluid-temperature and electrical-conductivity/resistivity probes were run in the water wells that are developed in red and gray mudstone and black shale of the Passaic Formation. Borehole flow analyses were conducted on two golf-course wells using a heat-pulse flow meter run under ambient and/or pumping conditions.
Heron Glen Golf Course Pond Well UMH ~1:12,000 scale map of the Golf Course, the wells and the pond. Figure 1. The Heron Glen Course course property boundary (blue line), well locations and IDs, and Ponds. Figure 2 (right). Natural gamma-ray and fluid temperature logs for wells 85 to 87. The gamma ray logs show two sharp peaks around 300 cps at two depths in each of the wells. These are probably black shale beds, because they commonly exceed 200 cps throughout the basin stratigraphic section. The depths (ft) to the top of the upper marker horizon (light blue outline UMH) are: Well 87 -100 Well 86 -80 Well 85 -160 Rider Structural Geology 310 2011 GCHERMAN
-100 Pond -160 -80 Heron Glen Golf Course 3-Point problem to solve the strike and dip of bedding based on the depth (red) value to a stratigraphic marker horizon in three wells Assuming that all three wells are at about the same surface elevation, the depth value in well 87 (–100) lies between the values for wells 85 (-160) and 86 (-80). 1) Draw a line (purple) through the wells with the highest and lowest values, and determine where –100 values lies along its length. There are -80 units difference. So -100 lies ¼ of the distance between the wells, from well 86: (-80/4= -20), -80 + -20 = -100. Strikeline strike angle dip -100 -140 -120 2) Draw a strike line from the -100 graticule to well 87, thereby connecting the two points where the bed is –100 ft. below the surface. N 3) Measure the strike angle from North, using a protractor (~30o). 4) The dip line is perpendicular to strike in the direction that beds are inclined. Figure 3. Details of figure 1.
-100 MAP VIEW Strikeline Pond D = 331 W E a Apparent dip line -160 -80 420 ft 86 85 Heron Glen Golf Course 3-Point problem to solve the strike and dip of bedding based on the depth (red) value to a stratigraphic marker horizon in three wells Knowing the distance between the two wells (D), and correlated stratigraphic depth points, we can use analytical geometry to calculate structural dip: A survey shows that there is 420 ft distance between wells 85 and 86. Strikeline strike angle 1) Calculate the length of the dip line (D) from well 86 to a strike line running through 85 (below). This is the horizontal distance along the dip line between wells 85 and 86 where the marker bed has 80 ft. vertical separation (or rise in a vertical plane containing line D) Because COS (a) = D / 420, D = COS(a) * 420 = (0.788 * 420) = ~331’ dip D N Figure 3. Details of figure 1.
Heron Glen Golf Course 3-Point problem to solve the strike and dip of bedding based on the depth (red) value to a stratigraphic marker horizon in three wells 2) Use the rise (80 ft) and the run (331 ft) to calculate the dip: Profile view -100 Distance (D) 331 Strikeline Well 85 Well 86 strike angle Depth 80 d (dip) dip 14 TAN (d)= opposite/adjacent d = TAN-1 (80/331) = 13.6o Pond -160 -80 THEREFORE, The strike and dip of bedding here is: 035/14 NW and the dip/dip azimuth equivalent is 14/305 N Figure 3. Details of figure 1.
PART 2 Apparent Dip In a similar manner, let’s say that we know the dip in the area from nearby outcrop readings (14o), and we want to determine the apparent bed dip for a cross section drawn through Wells 85 and 86. Using the apparent/true dip equation, TAN (l)=TAN (d) * COS (a), or l =TAN-1( TAN (d) * COS (a)). Therefore, solving for l: l = TAN-1(TAN (14) * COS (39)) = TAN-1 (0.249 * 0.777) = ~11o -100 Strikeline strike angle dip a Pond -160 -80 N Figure 3. Details of figure 1.
Figure 4. Map summarizing the results of the NJGS work at the Heron Glen Golf Course. Strike and dip of bedding near the wells stems from a statistical analysis of the optical borehole imaging results for the three wells.
Figure 5. Profile showing the results of the NJGS work at the Heron Glen Golf Course. Strike and dip of bedding near the wells stems from a statistical analysis of the optical borehole imaging results for the three
Structural Map Exercise 2 Three-point problems in areas of topographic relief.The Stony Brook-Millstone Research Well Field, Mercer County, NJ In the Heron Glen Golf Course 3-point problem, we assumed that depths to a stratigraphic marker horizon were referenced to the same elevation. In actuality, there is only small differences in the elevation of the three well heads, so that the assumption did not effect the outcome. However, in areas of noticeable topographic relief, depth reference to stratigraphic elevations must be made to a common datum, such as sea level, in order to make calculations that take spatial variations in surface elevation (or topographic variations) into account. Source: Maps and figures adapted from Rider/PDFs/NJGS_Bulletin_77_Appendixes_1-4.pdf Rider Structural Geology 310 2011 GCHERMAN
Stony Brook-Millstone Research Well Field 3-point problem The NJGS conducted a hydrogeological framework study of the the Brunswick aquifer at the hydrogeological research site (well field) located in the nature preserve at the Stony Brook - Millstone Watershed Association, Hopewell Twp., Mercer County, NJ. A circular array of wells were drilled in 1966 as test wells for a field project designed to demonstrate the uneven (anisotropic) groundwater flow directions in fractured shale. As part of the NJGS study, borehole images were collected for some of the wells during 2001-2008. The aquifer is red and gray mudstone and dark gray shale of the Passaic Formation. Complete the problem(s) on the following pages and hand them in at the start of next lab. Grading of the results will depend on the accuracy of your results, and the manner in which you present them.
Bedrock well Stony Brook-Millstone Research Well Field Bedrock monitoring wells were drilled in a circular arrangement about 300’ around a central pumping well (SB-1). The level of water within the monitoring wells varies during a pump test as a result of groundwater flowing unevenly through the rock to the pumping well. Over time, the water levels in wells aligned along bed strike drop faster than those aligned up- or down-dip. The NJGS collected borehole images in the wells with red symbols. The green lines are GPS tracks on foot trails.
SB-1 SB-3 SB-6 depth
Well and Marker Bed Elevations (MSL-ft) Ground Elevation Marker bed depth Marker bed elevation Well ID SB-1 167 71 167 - 71 = 96 SB-3 155 76 155 -76 = 79 SB-6 168 121 168 - 121 = 53 Print out the map on the next page and use it to complete this exercise. Using the Heron Glen example and method, determine the strike and dip of the bedrock strata from the elevation values for the maker bed. Use the 3-point problem to solve for bedding strike and dip. Put a strike and dip symbol on the map in the correct orientation with a dip label. Show all of your work and calculations in the margins. Attach (staple) an extra page if you prefer. There is bonus work on the last page. HINT: Use your engineer rule and the map scale to determine distance increments and distances between two wells and follow the procedure for the Heron Glen example.
Name: Date: Use the 3-point problem to solve for bedding strike and dip. Show your work on this sheet. Use a No. 2 pencil. Place and rotate the strike and dip symbol below on the map near SB-1 and SB-6 in the correct orientation with the correct dip value. Use this grouped symbol below: Print out the results and bring it to LAB 3. SB-6 53’ SB-3 79’ 96’ SB-1 SB-8 xx
Subsurface 3D view using SketchUp 2016 CAD software Image was screen-captured, saved and imported to scale and orientation in SketchUP 2016. 6-inch diameter, vertical cylinders were added at each well head and extruded to their respective lengths representing the elevations of the maker bed. Remember, you were given elevations, not depths, so a conversion must be done. Think about what this means mathematically. SB-3 73’ elevation Dipping bed plane 96’ elevation SB-1 SB-6 53’ elevation Ground surface The map distance (D) and elevation distance between two wells having a marker of know elevation difference (ED) can be used to calculate the apparent dip. It is only the true dip if the two wells are aligned along the dip direction as in this case for the Stonybrook-Millstone wellfield. The bed plane is depicted by simply connecting the respective depth points in each well of the marker bed. The map distance between two wells of know depth difference (D) can be used to calculate the apparent dip knowing the depth difference between two wells and the map distance between them. Map distance (D) from SB-1 to SB-6 Dipping bed plane SB-3 SB-1 Elevation distance (ED) between SB-1 to SB-6 Dip angle (acute angle) SB-6