Download
1 / 21
210 likes | 284 Vues
This study presents long-term outlooks for forest products demand and supply in Europe, aiding policy analysis and decision-making. The analysis includes multiple equation and single-equation models, groupings by country, and product groups like sawnwood and pulp. The models reflect consumption and production components and focus on understanding substitution behaviors. The study also gives projections for apparent consumption and production, incorporating factors like prices, GDP, and import values. Utilizing statistical tools and demand elasticities, the study offers insights into different scenarios for the European forest sector.

E N D
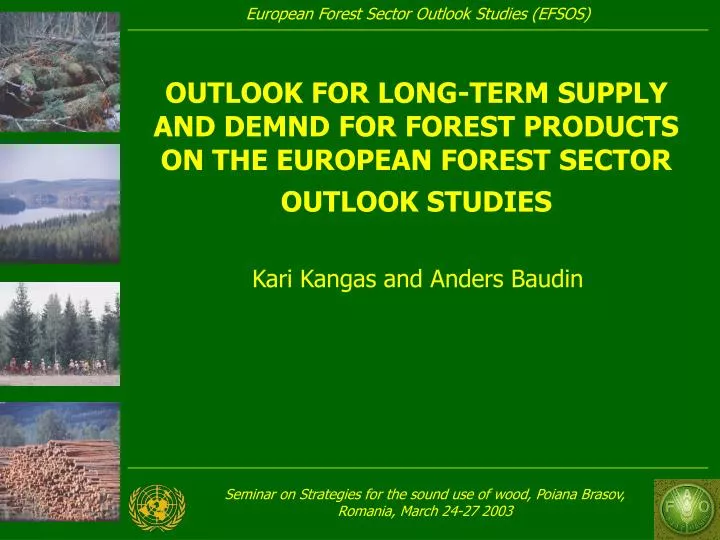
OUTLOOK FOR LONG-TERM SUPPLY AND DEMND FOR FOREST PRODUCTS ON THE EUROPEAN FOREST SECTOR OUTLOOK STUDIES • Kari Kangas and Anders Baudin
EFSOS – the European Forest Sector Outlook studiesPart of the activities of the Timber Committe • A next step taken from the European Timber Trends Studies (ETTS) - a history from 1953 to 1996
General objectives • A tool for policy analysis, forest management and industrial decision making • To present the outlook for European demand for forest products • To present the outlook for supply of roundwood from European forests • to present the outlook for the balance between timber supply and demand
Two Approaches to the Analysis of Demand and Supply • (a) a multiple equation model of demand (two equations) and supply (one equation), estimated for the countries that are the larger markets and/or major producers of forest products in Europe (Group I) • (b) two single-equation models of demand (apparent consumption), estimated for the other countries in west/central Europe (Group II) and two single-equation models estimated for former east bloc countries (Group III). A time series cross section approach
Country Groupings • Group I: Demand and supply models estimated • Austria, Finland, France, Germany, Italy, Norway, Spain, Sweden, • United Kingdom • Group II: Demand models estimated • Group II a • Belgium-Luxembourg, Denmark, Netherlands, Switzerland • Group II b • Greece, Ireland, Portugal, Turkey • Group III: Demand models estimated • Group III a • Czech Republic, Hungary, Poland, Russia, Ukraine • Group III b • Albania, Belarus, Bosnia, Bulgaria, Croatia, Estonia, Hungary, Latvia, Lithuania, The FYR of Macedonia, Slovakia, Slovenia, Yugoslavia
Product groups • Sawnwood • Coniferous Non-coniferous • Wood-based panels • Plywood Particleboard Fibreboard • Pulp and paper • Pulp • Recycled paper Wood pulp • Paper • Newsprint Printing & writing paper Other paper & board
Traditional Approach (Buongiorno a o): • CONSUMPTION = fn (Pd, Pm, X); and (1) • PRODUCTION = fn (Pd, Px, Z) (2) • where Pd is the price of domestically-produced goods, Pm is the price of imports, Px is the price of exports, X is additional factors that determine demand (demand shifters), and Z is additional factors that determine supply (supply shifters)
Expanding equations (1) and (2) to reflect the components of consumption and production yields the following: QDD = f(Pd, Pm, DD) (3) QM = f(Pd, Pm, DM) (4) QDS = f(Pd, Px, SD) (5) QX = f(Pd, Px, SX) (6) where QDD is demand for domestically-produced products, QM is import demand, QM is import demand, QDS is production (supply) for domestic markets (QDS = QDD), QX is production for export markets, Pd is the price in domestic markets, Pm is import price, Px is export price, DD are demand shifters for the domestic market, DM are demand shifters for import demand, SD are supply shifters for the domestic market and SX are supply shifters for the export market The multiple-equation model of demand and supply (a variant of an approach by Goldstein and Kahn)
Advantages • Demand and supply models are given in a consistent framework • The problems with the traditional supply modeling are avoided • An important aspect of (potential) substitution behavior can be directly examined. In both equations, the alternative source of supply may be a substitute, a relationship that would be indicated by positive cross-price elasticities • The equations are consistent with demand models in the framework of ETTS, and those found in the general literature, with the exception that multiple prices are used instead of a single price
Advantages • In (3), domestic price ("own price") is expected to have a negative sign, the sign on import price can be either positive (indicating substitution) or negative (complementarity). Similar expectations hold for the signs on prices in equation (4); import price should have a negative sign, and domestic price may have either a positive or a negative sign. • Projections of Apparent Consumption are given as the sum of (3) and (4) and Production as the sum of (3) and (6) • Similar arguments hold for equations (5) and (6)
Models of Forest Products Demand in Country Groups II and III • A traditional time series cross section approach • QT = fn (Pm, GDP, QT-1) (7) • where QT is apparent consumption, • Pm is import price (unit value) and • GDP is gross domestic product. • Import unit values in domestic, deflated currencies are converted to an index basis. Real GDP and consumption for each country also are converted to indexes to adjust for scale differences in currencies, and levels of consumption
EFSOS Statistical Tool Projection Tables Analysis File Basic File Timber Statistical Database and other statistical sources
Three scenarios • Baseline scenario (based on forecast input from NOBE) • Alternative scenario I: Increasing conservation, environmental regulation and public awareness • Alternative scenario II: European integration and market liberalisation
The baseline scenario • Projections taking into consideration: • General economic development • Demographic deveolpment • Construction • Paper recovery
Key figures form baseline (base), conservation (I) and integration (II) scenarios • EU/EFTA CEEC CIS • Base I II Base I II Base I II • GDP growth, %/a 2.2 1.7 2.6 4.3 2.8 5.4 4.6 2.7 6.0 • Consumption growth, %/a • Sawnwood 0.8 0.4 1.2 2.0 1.3 2.7 4.4 2.3 5.7 • Panels 1.6 0.9 2.4 3.0 2.0 3.9 5.1 2.9 6.8 • Paper and board 2.1 1.4 2.8 4.2 2.7 5.4 5.2 2.8 6.8
Key figures form baseline (base), conservation (I) and integration (II) scenarios – net trade in 2030(million cum and million metric tons) • EU/EFTA CEEC CIS • Base I II Base I II Base I II • Sawnwood -7.7 -7.1 -8.8 14.8 13.1 16.8 32.5 17.0 49.2 • Panels 0.5 2.5 -2.9 1.6 2.9 0.5 4.3 2.5 6.5 • Paper and board 3.6 7.4 -1.6 -4.9 -2.8 -7.6 6.8 3.4 10.2