Download
1 / 1
30 likes | 194 Vues
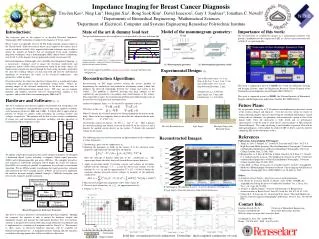
State of the art & dummy load test : The spectral characteristics of excised breast tissue provided by Jossinet & Schmitt [6]. Reconstruction Algorithms:

E N D
State of the art & dummy load test: The spectral characteristics of excised breast tissue provided by Jossinet & Schmitt [6] Reconstruction Algorithms: Reconstructing an EIT image involves solving the inverse problem of determining the conductivity and permittivity distribution within a body that produces the observed relationship between the voltage and current at the surface. The problem is ill-posed, meaning that large changes in the conductivity and permittivity can produce only small changes at the surface. This ill-posedness makes the reconstruction problem more difficult and results in the need for very high-precision instrumentation. In the low frequency limit ( ω = 0 ) Maxwell’s equations reduce to The results suggest that EIT is a promising modality to image the breast for malignancies. Therefore, in this case Where U denotes the electrical potential or voltage throughout the interior of the body. Hence in the low frequency limit we have that the voltage inside the body, B, satisfies . On the body’s surface, S, one has . Here υ denotes the outward pointing unit normal vector to the body B on the surface S, and j denotes the applied current density on the surface. V denotes the measured voltage on the surface. The following steps are used to reconstruct an approximation to the conductivity σ at low frequencies: • Introducing a guess for the conductivity, σ0. • Relating the potentials or fields on the surface S to the electrical tissue properties and field inside the body B by the identity • Here the subscript 0 denotes fields due to the conductivity σ0 . The superscripts denote the fields that result from different current densities. The 4x4 Electrode Array Agar Target The Agar Target with Electrode Array 3. Apply an electrode model [7] relating currents and voltages on electrodes labeled with the subscript l = 1, …,L into the above exact relation. Use the notation δσ = σ - σ0 and the approximation Uk = U0k + O(δσ) to obtain the equations relating measured current voltages to moments of the unknown conductivity 4. Measure and compute the components of the “data” matrix D. 5. Choose a basis of functions for approximation δσ by 6. Display σ = δσ + σ0 • 3D Image in 2D sequence (Layer 1 ~ Layer 8, thickness: 6.25 mm each ) • Agar target is located 6 mm away from the electrode array Impedance Imaging for Breast Cancer Diagnosis Tzu-Jen Kao1, Ning Liu3, Hongjun Xia1, Bong Seok Kim1, David Isaacson2, Gary J. Saulnier3, Jonathan C. Newell1 1Departments of Biomedical Engineering, 2Mathematical Sciences 3Department of Electrical, Computer and Systems Engineering Rensselaer Polytechnic Institute Model of the mammogram geometry: Importance of this work: The reconstruction of conductivity images in a mammogram geometry will provide a foundation for the comparison of EIT as a breast cancer detection tool with the X-ray mammography. Introduction: The long-term goal of this project is to develop Electrical Impedance Tomography (EIT) technology to improve the diagnosis of breast cancer. Breast Cancer is responsible for over 40,000 deaths annually among women in the United Stated. Early detection of breast cancer improves the chances that it can be treated successfully.Also, improved detection techniques may be able to reduce the number of biopsies that are performed. Even using combined diagnostic techniques, such as mammography, MRI, clinical breast examination, only 20-40 % of the biopsies that are performed actually reveal cancer [4]. Electrical Impedance Tomography, also called Electrical Impedance Imaging, is a non-invasive technique used to image the electrical conductivity and permittivity within a body from measurements taken on the body surface [5]. Small electric currents are passed through the body using electrodes attached to the skin; the resulting voltages are then measured and used by mathematical algorithms to reconstruct the values of the electrical conductivity and permittivity within the body. It has been known for some time that breast tumors have a significantly higher conductivity and permittivity than surrounding normal tissue. Hence, by forming images of the electrical conductivity of the breast, tumors may be detected and differentiated from normal tissue. EIT does not use ionizing radiation and employs relatively low-cost instrumentation, making it less expensive and/or safer than x-ray mammography, MRI and CT. Experimental Design:[3] Size of Electrode Array: 5 x 5 cm Dim. of the box : 5 cm x 5 cm x 5 cm Size of Electrode: 1.0 x 1.0 cm Gap between Electrodes: 2 mm Conductivity σ0 = 0.364 S/m Agar Target size: 5 mm cube Conductivity σ = 0.901 S/m This work is supported in part by CenSSIS, the Center for Subsurface Sensing and Imaging Systems, under the Engineering Research Centers Program of the National Science Foundation (Award Number EEC-9986821). This work is supported in part by NIBIB, the National Institute of Biomedical Imaging and Bioengineering under Grant Number R01-EB000456-01. Hardware and Software:[1, 2] The ACT 4 hardware and software supports 64 electrodes that will produce 3-D images of conductivity and permittivity in real time using applied excitations with frequencies between 1 KHz and 1 MHz. It will be able to apply arbitrary patterns of voltage or currents while measuring the resulting currents and voltages, respectively. The operator will be able to select various combinations of image rate and measurement precision, including real-time operation to visualization cardiac-frequency events. Future Plans: We are presently testing the ACT 4 hardware and implementing the initial version of the system software and firmware. Over the next few weeks we expect to begin collecting complete data sets and testing the instrument performance. Initial testing will use laboratory test phantoms with conductivity similar to that of the human body. Once the instrument is fully tested and its performance characterized, it will be used to study breast cancer patients at Massachusetts General Hospital. The study, involving a small number of patients who will be undergoing biopsies, will establish the ability of EIT to detect cancer by directly comparing EIT results with biopsy results. Reconstructed Images: • References • Publications Acknowledging NSF Support: • Ning Liu, Gary J. Saulnier, J.C. Newell, D. Isaacson and T-J Kao. “ACT4: A • High-Precision, Multi-frequency Electrical Impedance Tomography” Conference • on Biomedical Applications of Electrical Impedance Tomography, University • College London, June 22-24th, 2005. • 2. Hongjun Xia, A. S. Ross E. Brevdo, T-J Kao, Ning Liu, B. S. Kim, J.C. Newell, • G. J. Saulnier and D. Isaacson. “The Application software of ACT4.” Conference • on Biomedical Applications of Electrical Impedance Tomography, University • College London, June 22-24th, 2005. • 3. Choi, M.H., T-J Kao, D. Isaacson, G.J. Saulnier and J.C. Newell. “A Simplified • Model of a Mammography Geometry for Breast Cancer Imaging with Electrical • Impedance Tomography” Proc. IEEE-EMBS Conf. 26, In Press 2005. • Others: • 4. American Cancer Society, http://www.cancer.org/docroot/home • 5. M. Cheney, D. Isaacson, Newell, S. Simske, and J. Goble, “NOSER: An • Algorithm for Solving the Inverse Conductivity Problem”Int.. J. Imag. Syst. • Tech., vol. 2, pp. 66-75,1990. • 6. Jossinet, J. and M. Schmitt. “A review of Parameters for Bioelectrical • characterization of Breast Tissue” Ann. NY Acad. Sci. Vol. 873:30-41, 1999 • 7. Cheng, K-S., D. Isaacson, J.C. Newell and D.G. Gisser. “Electrode Models for • Electric Current Computed Tomography”IEEE Trans. Biomed. Eng. 36:918-924, 1989. To support a high-speed, high-precision, multi-channel instrument, we designed a distributed digital system, including a computer, digital signal processors (DSPs) and field-programmable gate arrays (FPGAs). The computer provides a user interface to control the instrument and to display the results for analysis. Four DSPs are working in parallel to implement the real-time reconstruction algorithm. We use FPGAs mainly to implement the signal generation, voltmeter and control for the ACT 4 analog circuits. FPGAs are also used to implement the interface between multiple channels through a VME-64x backplane, and between the computer and the instrument. Contact Info: Jonathan Newell, Ph. D. Professor of Biomedical Engineering E-mail: newelj@rpi.edu Rensselaer Polytechnic Institute Web site: http://www.rpi.edu/~newelj/eit.html 110 Eighth St. Troy, NY 12180-3590 Phone : 518-276-6433 FAX : 518-276-3035 The ACT 4 system is hosted by a Pentium-based personal computer. Through the computer, the operator is able to control the hardware, display and manipulate images and manage the information database. The user interface software is designed to be used in both clinical and laboratory environments and is implemented as a window-style program coded in Visual C++. The interface to allow access to low-level hardware functions will be available for laboratory/experimental use. A simplified interface offering only the functions needed for collecting patient data will be available for clinical use. Solid line: reconstructed voxel conductivity Dotted line: ideal computed conductivity of voxel