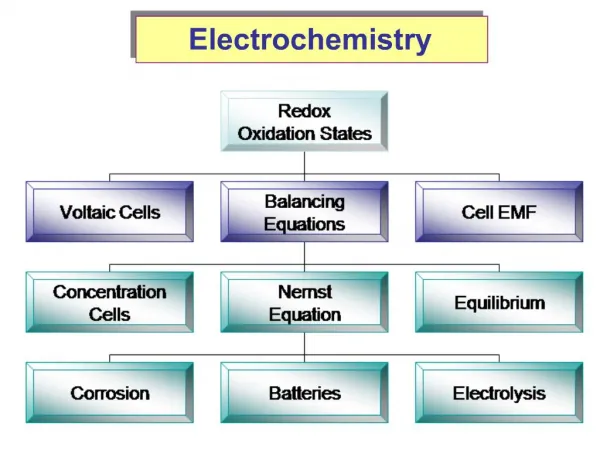
Electrochemistry MAE- 212
Electrochemistry MAE- 212. Dr. Marc Madou , UCI, Winter 2014 Class VII Pourbaix Diagrams. Table of content. Marcel Pourbaix Pourbaix Diagrams. Marcel Pourbaix.

Electrochemistry MAE- 212
E N D
Presentation Transcript
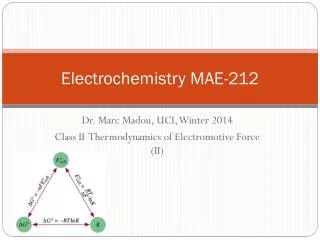
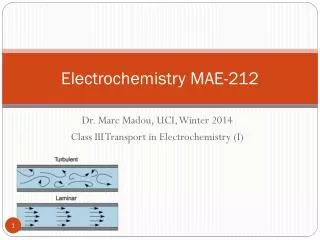
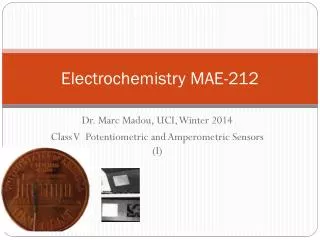
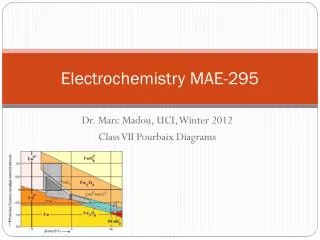
Electrochemistry MAE-212 Dr. Marc Madou, UCI, Winter 2014 Class VII Pourbaix Diagrams
Table of content • Marcel Pourbaix • Pourbaix Diagrams
Marcel Pourbaix • Marcel Pourbaix provided the brilliant means to utilize thermodynamics more effectively in corrosion science and electrochemistry in general. This development resulted in four important books that interpret his work: Thermodynamics of Dilute Aqueous Solutions, Atlas of Electrochemical Equilibria in Aqueous Solutions (solid-aqueous equilibria); Lectures on Electrochemical Corrosion (a teaching text); and, in his last years, Atlas of Chemical and Electrochemical Equilibria in the Presence of a Gaseous Phase (solid-gaseous equilibria). • His outstanding work in thermodynamics provided one of the main underpinnings of electrochemistry, especially in corrosion science. Marcel Pourbaix b. 1904, Myshega, Russia d. September 28, 1998, Uccle (Brussels), Belgium
Marcel Pourbaix • Marcel Pourbaix (1904-1998) • Marcel Pourbaix was born in Russia, where his father, a Belgian engineer, was working at the time. • The significance of Marcel Pourbaix’s great achievementwas pointed out by Ulick R. Evans, widely recognized as the “father of corrosion science,” in his foreword to Pourbaix’sThermodynamics of Dilute Aqueous Solutions: “During the lastdecade (the 1940s) Dr. Marcel Pourbaix of Brussels has developed a graphical method, based on generalized thermodynamical equations, for the solution of many different kinds of scientific problems, involving numerous types of heterogeneous or homogeneous reactions and equilibria... Some of these problems have long been treated from the aspect of thermodynamics... The application of thermodynamics to typical corrosion reactions is a much newer development.”
For Mr. Zhang Zhongcheng As a memory of his stay at Cebelcor in 1984/1985. With all best wishes from Marcel Pourbaix April 26, 1985
Pourbaix Diagrams • Through the use of thermodynamic theory (the Nernst equation), so-called Pourbaix diagrams can be constructed. These diagrams show the thermodynamic stability of species as a function of potential and pH. Although many basic assumptions must be considered in their derivation, such diagrams can provide valuable information in the study of corrosion phenomena. The diagram on the right represents a simplified version of the Pourbaix diagram for the iron-water system at ambient temperature. For the diagram shown, only anhydrous oxide species were considered and not all of the possible thermodynamic species are shown. • How do we construct this diagram for water?
OxidationFaster ReductionSlower Potential OxidationSlower Rates equal ReductionFaster pH Pourbaix Diagrams • Use Nernst Equation:
2H2O = O2 + 4H+ + 4e- Equilibrium potential falls as pH increases 2.0 1.6 O2 is stable 1.2 2H+ + 2e- = H2 Equilibrium potential falls as pH increases 0.8 Potential 0.4 H2O is stable 0.0 -0.4 -0.8 H2 is stable -1.2 -1.6 0 7 14 Pourbaix Diagrams
Pourbaix Diagrams • We will consider Cu in an aqueous solution as the next exercise: five different reactions are involved. 7
Pourbaix Diagrams • The diagram shown here shows how the potentials for reduction and oxidation of water vary with pH for natural waters. These are the inner two lines that slope downward from low pH to high pH. Note that the pH scale only runs from 2-10 (we are talking here about natural waters). For both oxidation and reduction of water, an additional line is shown that lies 0.6V above (for oxidation of water) or below (for reduction) the theoretical E. This pair of lines represents the potentials including an approximation for the overvoltage. Lastly, there is a pair of vertical lines at pH=4 and 9. These are reflective of the fact that most natural waters have a pH somewhere between these limits. . MAE 217-Professor Marc J. Madou
Pourbaix Diagrams • A Pourbaix diagram is an attempt to overlay the redox and acid-base chemistry of an element onto the water stability diagram. The data that are required are redox potentials and equilibrium constants (e.g. solubility products). On the right is the Pourbaix diagram for iron. Below that is the same diagram showing only those species stable between the water limits. MAE 217-Professor Marc J. Madou
Equilibrium Reactions of iron in Water 1. 2 e- + 2H+ = H2 2. 4 e- + O2 + 4H+ = 2H2O 3. 2 e- + Fe(OH)2 + 2H+ = Fe + 2H2O 4. 2 e- + Fe2+ = Fe 5. 2 e- + Fe(OH)3- + 3H+ = Fe + 3H2O 6. e- + Fe(OH)3 + H+ = Fe(OH)2 + H2O 7. e- + Fe(OH)3 + 3H+ = Fe2+ + 3H2O 8. Fe(OH)3- + H+ = Fe(OH)2 + H2O 9. e- + Fe(OH)3 = Fe(OH)3- 10. Fe3+ + 3H2O = Fe(OH)3 + 3H+ 11. Fe2+ + 2H2O = Fe(OH)2 + 2H+ 12. e- + Fe3+ = Fe2+ 13. Fe2+ + H2O = FeOH+ + H+ 14. FeOH+ + H2O = Fe(OH)2(sln) + H+ 15. Fe(OH)2(sln) + H2O = Fe(OH)3- + H+ 16. Fe3+ + H2O = FeOH2+ + H+ 17. FeOH2+ + H2O = Fe(OH)2+ + H+ 18. Fe(OH)2+ + H2O = Fe(OH)3(sln) + H+ 19. FeOH2+ + H+ = Fe2+ + H2O 20. e- + Fe(OH)2+ + 2H+ = Fe2+ + 2H2O 21. e- + Fe(OH)3(sln) + H+ = Fe(OH)2(sln) + H2O 22. e- + Fe(OH)3(sln) + 2H+ = FeOH+ + 2H2O 23. e- + Fe(OH)3(sln) + 3H+ = Fe2+ + 3H2O Pourbaix Diagrams MAE 217-Professor Marc J. Madou
Pourbaix Diagrams • Some limitations of Pourbaix diagrams include: • No information on corrosion kinetics is provided by these thermodynamically derived diagrams. • The diagrams are derived for specific temperature and pressure conditions. • The diagrams are derived for selected concentrations of ionic species (10-6 M for the above diagram). • Most diagrams consider pure substances only - for example the above diagram applies to pure water and pure iron only. Additional computations must be made if other species are involved. • In areas where a Pourbaix diagram shows oxides to be thermodynamically stable, these oxides are not necessarily of a protective (passivating) nature. MAE 217-Professor Marc J. Madou
Pourbaix Diagrams MAE 217-Professor Marc J. Madou