Download
1 / 1
10 likes | 105 Vues
Investigating contaminated sediment impact on Connecticut River, analyzing trace metal concentrations (Pb, Ni, Co, Cu) using ICP-OES. Discusses historical metal discharges and river health. Study identifies problematic areas along the river.

E N D
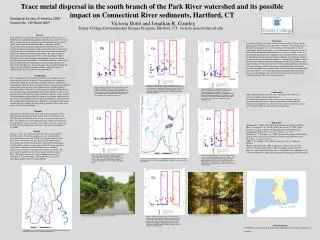
Geological Society of America 2009 Session No. 119-Booth #407 Trinity College Environmental Science Program, Hartford, CT, victoria.done@trincoll.edu Abstract The Park River is an impaired urban river that flows through the city of Hartford and surrounding municipalities and ultimately into the Connecticut River. A major factor that contributes to the deterioration of the sediment quality in the south branch of the Park River is the observed high concentration of trace metals discharged directly into the stream. We examine the downstream dispersal of trace metals Pb, Ni, Co, and Cu from their point sources to determine to what extent trace metal contamination impacts the sediments of the Connecticut River. The concentrations of metals were analyzed using the ICP-OES. The online Right-to-Know Network was also used to determine the historical amounts of reported metal discharges into the Park River. In the Connecticut River (upstream of the city of Hartford), Pbconcentrations range from approximately 1-29 ppm. In the Park River, the Pb concentrations range from 40-250 ppm and suggest that the Park River sediment could be a significant source of anthropogenic trace metals into the Connecticut River. Discussion As is shown in Figures 1-6, there are elevated concentrations of heavy metals present in the south branch of the Park River watershed. The problematic areas (the spikes in the graphs) seem to be occurring in the same places along the south branch. These specific places are two if the most downstream sections in both the Piper Brook and the Trout Brook. As can be seen in Map 1, there is a great concentration of industries along the banks of the Trout Brook and close to the Piper Brook. Besides some auto repair companies, the bulk of the industries are metal plating or metal finishing companies. According to the Right-to-Know Network, these industries have been dumping metals like lead, chromium, and copper into the river for at least 20 years. This is problematic because the metals seem to be settling out close to their sources which makes this stretch of the river unhealthy While this is good in some ways (the metals are not making their way to the CT River), it is very detrimental to the health of this stream where trout used to be abundant. Also, these concentrations, if present in the water, would be absolutely lethal to any living organism. Pb Co Cr Introduction The south branch of the river has had a history of waste disposal, as was discussed by Dr. Gourley in his talk. More specifically these industries include metal finishing, metal plating, aerospace industries, and firearms manufacturing. Because of this, the purpose of my experiment was to find the concentrations of trace metals in the sediment of the Park River and the Connecticut River. From this I was able to observe whether the Park River has any affect on the sediment quality of the Connecticut River. The specific metals I analyzed include lead, copper, chromium, cadmium, cobalt, and zinc. Using the sediment collected from last summer, this summer, and throughout the semester, I compared the south branch of the Park River, and Connecticut River and used the north branch of the Park River as the control to determine whether there was evidence for the Park River having an effect on the water quality of the Connecticut River. Trace metal dispersal in the south branch of the Park River watershed and its possible impact on Connecticut River sediments, Hartford, CT Figure 2: This graph shows the cobalt concentrations across the Park River watershed. There is an increasing trend from upstream to downstream with a peak in the Trout Brook section. Also, the CT River values start at a higher concentration (relative to the Park River concentrations) and again do not seem to be affected by the Park River sediments. Figure 1: This figure shows the lead concentrations across the Park River watershed. There is an increasing trend from upstream to downstream and there is a prominent spike in the downstream section of the Trout Brook. The Park River seems to not be having an effect on the CT River sediment because these data points show a slight decreasing trend. Figure 3: This figure shows the chromium concentrations across the Park River watershed. This graph also shows a positive correlation between distance downstream and increasing chromium concentrations. There are two prominent spikes in the south branch, specifically in the Piper Brook and Trout Brook tributaries. The Park River doesn’t not seem to be affecting the sediment quality of the CT River because there is no change between the upstream and downstream sites. • Conclusions • More sediment collection at other sites, especially on the CT River, is necessary to make a more in-depth analysis. • It would also be important to take a closer look at where the spikes are occurring in the data (certain sections of Piper Brook and Trout Brook). • The next step would then be to determine how readily available these metals are to the biota and the possible effects on human health. Methods Sediment was collected at each site by wet-sieving it through a 45 µm filter and into a polyethylene bottle washed with 5% hydrochloric acid. The sediment was then dried out in an oven at a constant temperature of 60 C. The sediment was then weighed into 0.5 g aliquots and digested in 5% hydrochloric acid for two hours. The samples were then run through the ICP-OES. This method was followed as was laid out in Giddings et al. (2000). Cd Zn • References • Giddings, M. I. (2001). Trace-Metal Concentrations in Sediment and Water • Hou, A., DeLaune, R. D., Tan, M., Reams, M., & Laws, E. (2009). Toxic Elements in Aquatic Sediments: Distinguishing Natural Variability from Anthropogenic Effects. Water, Air & Soil Pollution , 179-191. • Kauffman, G. J., & Belden, A. C. (2009). Water Quality Trends (1970 to 2005) Along Delaware Streams in the Delaware and Chesapeake Bay Watersheds, USA. Water, Air & Soil Pollution . • Miller, J. R., & Miller, S. M. (2007). Contaminated Rivers. Dordrecht: Springer. • Right-to-Know Network. (2008, September 22). TRI Facilities for West Hartford, CT. Retrieved October 2, 2009, from Right-to-Know Network: http://www.rtknet.org/db/tri/tri.php?city=west+hartford&state=ct&dbtype=C&rsei=y&sortp=D&detail=-1&datype=T&reptype=f&reporting_year=&submit=GO Results Figures 1-6 show the concentrations of trace metals across the Park River Watershed. The data is graphed across the watershed from upstream to downstream. The CT River site graphed before the Park River data is located above the Park River outflow and the other is located under the outflow. The blue circles represent the north branch of the Park River which are used as the control. The orange diamonds represent the south branch of the Park River where the highest concentration of industries and impervious surfaces are located. The green squares signify the levels of trace metals in the Connecticut River. The purple and red boxes represent different areas in the watershed, as is shown in Map 1. The purple box is a part of the Piper Brook and the red box is in Trout Brook. Victoria Doñé and Jonathan R. Gourley Figure 4: This figure portrays the cadmium concentrations across the Park River watershed as well as CT River concentrations. There is a clear spike in cadmium levels in the lower section of the Trout Brook where the highest concentration of industries is located and also in the Piper Brook. Figure 6: Graphed in this figure are the concentrations of zinc across the Park River watershed and into the CT River. There s an increasing trend from downstream to upstream with a significant spike in concentrations located in the Piper Brook. The CT River concentrations do not change much which suggests that the south branch has no effect on the it in terms of sediment quality. Map 2: This map shows the specific peaks highlighted in figures 1-6. The red contains the lowest section of the Trout Brook and the purple contains the lowest section of the Piper Brook. Cu Photograph by Nathan Sell Photograph by Nathan Sell Picture 1: This is a picture of a site on the south branch of the Park River . There is barely any vegetation growing over the stream and it has been channelized. Picture 2: This is a site along the north branch of the Park River. There are anthropogenic influences present and is more isolated than the site shown in picture 1. Figure 5: This figure shows the copper concentrations from upstream to downstream in the Park River watershed as well as two CT River sites. There is a clear increasing trend with a high spike located in the Piper Brook tributary of the south branch of the Park River. The CT River values have a very slight decreasing trend, with the Park River having no obvious effect on its sediment quality. Acknowledgments I would like to thank Trinity Faculty Research Committee for the grants to facilitate my research. Map 1: This map shows the leachate discharges (represented by the red circles) within the Park River watershed. There is a high concentration of discharges located in the most downstream sections of the Trout Brook and Piper Brook. Figure 1: This figure portrays the cadmium concentrations across the Park River watershed as well as Connecticut River concentrations. There is a clear spike in cadmium levels in the lower section of the Trout Brook where the highest concentration of industries is located.