Download
1 / 61
640 likes | 879 Vues
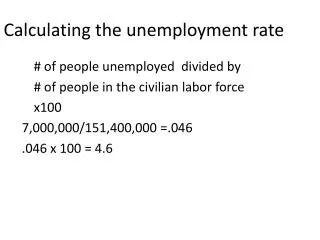
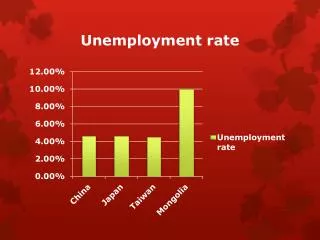
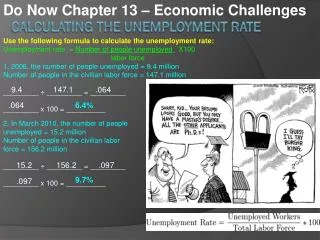
Use the following formula to calculate the unemployment rate: Unemployment rate = Number of people unemployed X100 labor force 1. 2006, the number of people unemployed = 9.4 million

E N D
Use the following formula to calculate the unemployment rate: Unemployment rate = Number of people unemployed X100 labor force 1. 2006, the number of people unemployed = 9.4 million Number of people in the civilian labor force = 147.1 million _________ ÷ _________ = _________ _________ x 100 = __________ Do Now Chapter 13 – Economic Challenges 9.4 147.1 .064 .064 6.4% Calculating the unemployment rate 2. In March 2010, the number of people unemployed = 15.2 million Number of people in the civilian labor force = 156.2 million _________ ÷ _________ = _________ _________ x 100 = __________ 15.2 156.2 .097 9.7% .097
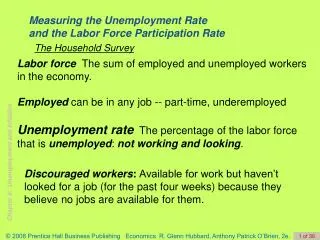
Chapter 13 – Economic ChallengesSection 1 - Unemployment • Employed – people work as paid employees, own their own business, unpaid workers in a family business, people who had jobs but temporarily absent • Full-time and part-time workers • Unemployed – workers without jobs, were available for work and tried to find employment in the past 4 weeks • Not in labor force – do not fit in previous two categories, full-time student, homemaker, or retiree
Labor Force • Labor force – Total number of workers; number of employed + unemployed workers • 2007, labor force = 146.0 + 7.1 = 153.1 million • Unemployment rate = (7.1/153.1) X 100 = 4.6%
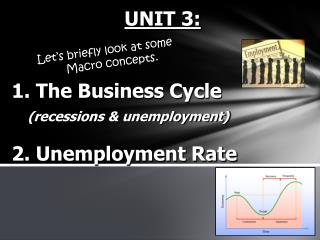
Types of Unemployment • Frictional Unemployment – always present in the economy, resulting from temporary transitions made by workers and employers; occurs when people take time to find a job • Seasonal Unemployment – occurs as a result of season, vacations, or when industries slow or shut down for a season • Structural Unemployment – workers skill do not match the jobs that are available • Cyclical Unemployment – rises during economic downturns and falls when the economy improves
Measuring Unemployment • Number of unemployed people divided by the total labor force multiplied by 100 • Unemployment rate – percentage of the nations’ labor force that is unemployed • Unemployment rate is an indication of the health of a nation’s economy
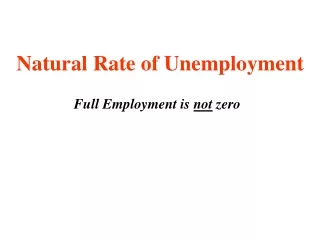
Full Employment • Natural rate of unemployment – normal rate of unemployment around which the unemployment rate fluctuates (4-6%) • Zero unemployment is not an achievable goal because of frictional unemployment • Underemployment – working at a job for which one is overqualified, or working part-time when full-time work is desired • Discouraged workers – a person who wants a job, but has given up looking (do not count against unemployment rate)
The breakdown of the population in 2007 The Bureau of Labor Statistics divides the adult population into three categories: employed, unemployed, and not in the labor force.
Unemployment Insurance • Unemployment insurance - government program to protect workers’ incomes when they become unemployed • Eligible – people who are laid off through no fault of their own • Ineligible – people who quit, were fired for cause, or just entered the labor force • Unemployment Insurance can increase frictional unemployment by taking away incentive to find a job • 1985 case study in Illinois showed people not receiving checks were unemployed by a 7% shorter period
Flow Chart Types of Unemployment, pgs. 331 - 334 Types of Unemployment Frictional Seasonal Structural Cyclical Book Examples 1. 2. 3. Book Examples 1.2. 3. Book Examples 1. 2. 3. 4. 5. Book Examples 1. 2. Your Example 1. Your Example 1. Your Example 1. Your Example 1.
Flow Chart Types of Unemployment, pgs. 331 - 334 Types of Unemployment Frictional Seasonal Structural Cyclical Book Examples 1. Hannah left her job at a large hospital to look for a job at a smaller health clinic. 2. Jorge graduated from law school, he is currently interviewing for jobs. 3. Liz left the labor force to take care of an aging parent, she has returned to the labor force. Book Examples 1.2. 3. Book Examples 1. 2. 3. 4. 5. Book Examples 1. 2. Your Example 1. Your Example 1. Your Example 1. Your Example 1.
Flow Chart Types of Unemployment, pgs. 331 - 334 Types of Unemployment Frictional Seasonal Structural Cyclical Book Examples 1. Hannah left her job at a large hospital to look for a job at a smaller health clinic. 2. Jorge graduated from law school, he is currently interviewing for jobs. 3. Liz left the labor force to take care of an aging parent, she has returned to the labor force. Book Examples 1. Brick mason lays off his workers every winter, hires every spring.2. School ends, students find a summer job. Begins, leave the job for school. 3. Migrant farmers lose their job during the winter, droughts or too much rain. Book Examples 1. 2. 3. 4. 5. Book Examples 1. 2. Your Example 1. Your Example 1. Your Example 1. Your Example 1.
Flow Chart Types of Unemployment, pgs. 331 - 334 Types of Unemployment Frictional Seasonal Structural Cyclical Book Examples 1. Hannah left her job at a large hospital to look for a job at a smaller health clinic. 2. Jorge graduated from law school, he is currently interviewing for jobs. 3. Liz left the labor force to take care of an aging parent, she has returned to the labor force. Book Examples 1. Gregory lays off his workers every winter, hires every spring.2. School ends, students find a summer job. Begins, leave the job for school. 3. Migrant farmers lose their job during the winter, droughts or too much rain. Book Examples 1. 2. 3. 4. 5. Book Examples 1. New technology puts people out of work, CD’s put out the workers in the phonographic market. 2. Discovery of new resources, oil supplanted whale-oil as an energy source. 3. Changes in consumer demand, people favor one item over another. 4. Globalization, GM moves their factory, people lose their jobs. 5. Lack of Education can affect the marketability of an individual looking for a job. Book Examples 1. 2. Your Example 1. Your Example 1. Your Example 1. Your Example 1.
Flow Chart Types of Unemployment, pgs. 331 - 334 Types of Unemployment Frictional Seasonal Structural Cyclical Book Examples 1. Hannah left her job at a large hospital to look for a job at a smaller health clinic. 2. Jorge graduated from law school, he is currently interviewing for jobs. 3. Liz left the labor force to take care of an aging parent, she has returned to the labor force. Book Examples 1. Gregory lays off his workers every winter, hires every spring.2. School ends, students find a summer job. Begins, leave the job for school. 3. Migrant farmers lose their job during the winter, droughts or too much rain. Book Examples 1. New technology puts people out of work, CD’s put out the workers in the phonographic market. 2. Discovery of new resources, oil supplanted whale-oil as an energy source. 3. Changes in consumer demand, people favor one item over another. 4. Globalization, GM moves their factory, people lose their jobs. 5. Lack of Education can affect the marketability of an individual looking for a job. Book Examples 1. Workers in the steel industry are affected by the downturn in the economy. 2. During the great depression the unemployment rate spiked to 25%. Your Example 1. Your Example 1. Your Example 1. Your Example 1.
Review - Unemployment Statistics The country of Ecoland has collected the following information: Population 240,000 Employed 180,000 Unemployed 30,000 Determine the following: 1. Labor Force = __________ + _______ = _____________ 2. Unemployment rate = (_________/_________) X 100% = ______ 3. Labor-force participation rate = (_______/_______) X 100% = _______ 180,000 30,000 210,000 30,000 210,000 14.3% 210,000 240,000 87.5%
Types of Unemployment Chart Cyclical Unemployment Frictional Frictional Structural Cyclical Cyclical Structural Seasonal
Section 2 - Inflation • Inflation – a general increase in prices • Inflation rate – percentage change in the price level from the previous period or base year. • Normal rate is about 3% • Hyperinflation – inflation that is out of control http://www.youtube.com/watch?v=Vg4-gMW89E0&feature=player_detailpage#t=0s • Deflation – sustained drop in the price levels • In 2009, the Consumer Price Index fell for the first time since 1955 • Purchasing power – the ability to purchase goods and services • Fixed Income – income that does not increase when prices go up
Causes of Inflation • Quantity Theory – too much money in the economy causes inflation • Demand-Pull Theory – inflation occurs when demand for goods and services exceeds existing supplies • Cost – Push Theory – inflation occurs when producers raise prices in order to meet increasing costs of inputs
Consumer Price Index • Consumer Price Index – a measure of the overall cost of goods and services bought by the typical urban consumer • Computed each month by the Bureau of Labor Statistics (BLS), part of the Department of Labor • Market Basket – a metaphorical object to represent a collection of goods and services • Derived of more than 200 sub-categories, arranged into eight major groups • Weighted based on the importance of an item to the consumer
Price Index • Price Index – shows how the average price of a standard group of goods changes over time • Cost of living - The average cost of the basic necessities of life, such as food, shelter, and clothing.
Consumer Price Index FOOD AND BEVERAGES (breakfast cereal, milk, coffee, chicken, wine, full service meals, snacks) HOUSING (rent of primary residence, owners' equivalent rent, fuel oil, bedroom furniture) APPAREL (men's shirts and sweaters, women's dresses, jewelry) TRANSPORTATION (new vehicles, airline fares, gasoline, motor vehicle insurance) MEDICAL CARE (prescription drugs and medical supplies, physicians' services, eyeglasses and eye care, hospital services) RECREATION (televisions, toys, pets and pet products, sports equipment, admissions); EDUCATION AND COMMUNICATION (college tuition, postage, telephone services, computer software and accessories); OTHER GOODS AND SERVICES (tobacco and smoking products, haircuts and other personal services, funeral expenses). • Market Basket for Products 2008 – $3858.18
The typical basket of goods and services This figure shows how the typical urban consumer divides spending among various categories of goods and services. The Bureau of Labor Statistics calls each percentage the “relative importance” of the category.
Determining Consumer Price Index • CPI = Price of basket of goods and services in current year X 100 Price of basket in base year period • Base Period is between 1982 – 1984 • 1982-1984 – $1792.00 • Market Basket for Products • 2008 – $3858.18 • 3858.18/1792 = 2.1530 • 2.15 X100 = 215.3 • 2008 CPI = 215.3 • Prices have inflated by 115.3% from base period (1982-1984) to 2008
Determining inflation • Inflation = CPI in year 2 – CPI in year 1 X 100 CPI in year 1 • 2008 – 215.30 • 2007 – 207.34 • 215.30 – 207.34 = 7.96 • 7.96/207.34 = .0384 • .0384 X 100 = 3.84% • Prices have inflated by 3.84% from 2007 to 2008