Download

1 / 16
160 likes | 307 Vues
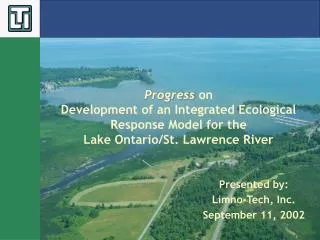
Land-Use Model for Lake Bellaire, Clam Lake, and Torch Lake Watersheds. built by. Limno-Tech, Inc., Ann Arbor, Michigan, Excellence in Environmental Solutions Since 1975. for. Three Lakes Association as part of a 2006 M-DEQ Grant Clean Michigan Initiative.

E N D
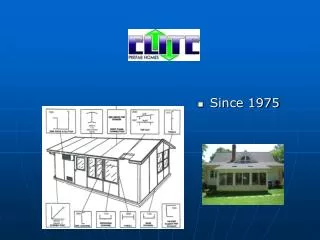
Land-Use Model forLake Bellaire, Clam Lake, and Torch Lake Watersheds built by Limno-Tech, Inc., Ann Arbor, Michigan, Excellence in Environmental Solutions Since 1975 for Three Lakes Association as part of a 2006 M-DEQ Grant Clean Michigan Initiative
Land-Use ModelLake Bellaire, Clam Lake, and Torch Lake WatershedsJanuary 15, 2007 • Purpose: To estimate changes in phosphorus loadings based as land uses propose to change… • Population expected to double in the next 25 years • Phosphorus loadings, key input to new water quality models
Watershed modeling overview Watershed Delineation Phosphorus loading rates by land use Groundwater loads Inputs Watershed Model Annual phosphorus Loads, kg/yr Land Use Septic loads Other non-point sources Outputs
Use Changes Land Use Model Phosphorus Level Lake Model Water Clarity
Watershed Sizes(land only) Lake Bellaire (land area only) 29,471 acres Clam Lake (land area only) 17,902 acres Three Lakes (Bellaire, Clam, Torch) 29,184 acres 76,557 acres Elk River Chain of Lakes (500 sq. miles) 330,000 acres
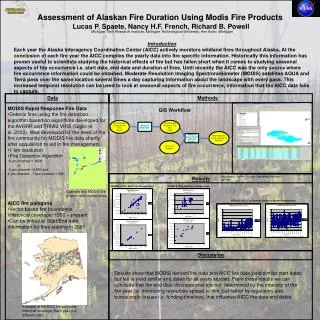
Study areas and Sampling locations
Phosphorus Loading Coefficients Land UsePhosphorus (kg/acre-yr) • High Density Development0.283 About 5.6 dwellings per acre • Low Density Development0.223 One house per acre • Golf Course 0.186 • Cropland 0.061 • Pasture 0.053 • Forest 0.045
Phosphorus Monitoring Subwatersheds Lake BellairePhosphorus Loads, 2006 • Intermediate River below Intermediate Lake 372 kg P/yr • Cedar River, at Burrel Road 1,116 • Intermediate River, at Bellaire Highway Bridge 571 • Lower Intermediate River, at entrance to Lake Bellaire 176 • Butler Creek 186 • Maury Creek 32 • Lake Bellaire shoreline (estimated)426 Total 2,508 Clam Lake • Upper Grass River, at Knapp dock • Shanty Creek 101 • Cold Creek 497 • Finch Creek 267 • Lower Grass River, at Grass River Nat’l Area dock 160 • Dewey Creek 67 • Clam Lake shoreline (estimated) 282 Total 1,374
Applications of Land-Use Model Forecast Phosphorus Loadings25-Year Growth, 2006 to 2031(population doubling) Scenario #1: Schuss Mtn-Shanty Creek Area 12 square miles (7,680 acres) 6.5% forest to High Density Housing 6.5% forest to Low Density Housing All new dwellings sewered, 80% P removal +298 kg All new dwellings septic systems: +741 kg
Use Changes Land Use Model Phosphorus Level Lake Model Water Clarity
Best Management Practices (BMP) Techniques to reduce phosphorus run-off • Retention & Detention Basins • Infiltration Trenches • Landscaped Swales • Stormwater & Natural Wetlands • Buffer Strips Properly designed and installed BMP can reduce phosphorus loading up to 50%
Local Units of Government Possible Phosphorus-related Actions • Master Plans: specific language on water quality • Require phosphorus estimates in major site plans • Require septic inspections on sale of property • Require action on exceeding phosphorus levels • Establish overlay ordinances, permit requirements • Establish multi-jurisdictional districts, P.A. 264
Local Units of Government (continued) Possible Phosphorus-related Actions • Inventory township’s property, BMP needs (BMP = Best Management Practices to reduce phosphorus run off) Re-enforce bridge abutment erosion Detention of run off from parks Stream shoreline erosion controls • Other actions to reduce phosphorus Restrict phosphorus in lawn and agricultural fertilizers Restrict use of phosphorus dish detergents Restrict septage use on farmland