LIQUID CHROMATOGRAPHY
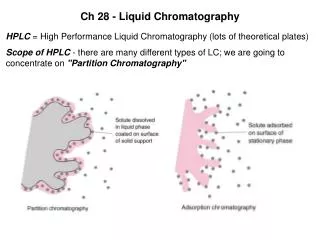
LIQUID CHROMATOGRAPHY. CHAPTER 21 pg. 604 Adsorption Chromatography. Introduction. The principle of liquid chromatography is a separation process based on distribution between two phases, where the sample components is propelled by liquid which percolates a solid stationary phase. .

LIQUID CHROMATOGRAPHY
E N D
Presentation Transcript
LIQUID CHROMATOGRAPHY CHAPTER 21 pg. 604 Adsorption Chromatography
Introduction The principle of liquid chromatography is a separation process based on distribution between two phases, where the sample components is propelled by liquid which percolates a solid stationary phase.
Liquid Chromatography • Chromatography in which the mobile phase is a liquid. • The liquid used as the mobile phase is called the “eluent”. • The stationary phase is usually a solid or a liquid. • In general, it is possible to analyze any substance that can be stably dissolved in the mobile phase.
Column Chromatography and Planar Chromatography Separation column Paper or a substrate coated with particles Packing material Paper Chromatography Thin Layer Chromatography (TLC) Column Chromatography
Separation Process and Chromatogram for Column Chromatography Chromatogram Output concentration Time
Chromatogram tR tR : Retention time Peak Intensity of detector signal t0 t0 : Non-retention time h A : Peak area A h : Peak height Time
From Liquid Chromatography to High Performance Liquid Chromatography • Higher degree of separation! Refinement of packing material (3 to 10 µm) • Reduction of analysis time! Delivery of eluent by pump Demand for special equipment that can withstand high pressures The arrival of high performance liquid chromatography!
Flow Channel Diagram for High Performance Liquid Chromatograph Detector Column Column oven (thermostatic column chamber) Pump Sample injection unit (injector) Drain Eluent (mobile phase) Data processor Degasser http://www.lcresources.com/resources/getstart/2c01.htm
Detection in HPLC *There are six major HPLC detectors: • Refractive Index (RI) Detector • Evaporative Light Scattering Detector (ELSD) • UV/VIS Absorption Detectors • The Fluorescence Detector • Electrochemical Detectors (ECDs) • Conductivity Detector * The type of detector utilized depends on the characteristics of the analyte of interest. http://www.waters.com/WatersDivision/Contentd.asp?watersit=JDRS-6UXGZ4
Refractive Index Detector • Based on the principle that every transparent substance will slow the speed of light passing through it. • Results in the bending of light as it passes to another material of different density. • Refractive index = how much the light is bent • The presence of analyte molecules in the mobile phase will generally change its RI by an amount almost linearly proportional to its concentrations. http://farside.ph.utexas.edu/teaching/302l/lectures/img1154.png
Refractive Index Detector • Affected by slight changes in mobile phase composition and temperature. • Universal-based on a property of the mobile phase • It is used for analytes which give no response with other more sensitive and selective detectors. • RI = general • responds to the presence of all solutes in the mobile phase. • Reference= mobile phase • Sample= column effluent • Detector measures the differences between the RI of the reference and the sample. http://hplc.chem.shu.edu/HPLC/index.html
Evaporative Light Scattering Detector (ELSD) • Analyte particles don’t scatter light when dissolved in a liquid mobile phase. • Three steps: 1) Nebulize the mobile phase effluent into droplets. • Passes through a needle and mixes with hydrogen gas. 2) Evaporate each of these droplets. • Leaves behind a small particle of nonvolatile analyte 3) Light scattering • Sample particles pass through a cell and scatter light from a laser beam which is detected and generates a signal. http://www.sedere.com/WLD/whatis.html
UV/VIS Absorption Detectors • Different compounds will absorb different amounts of light in the UV and visible regions. • A beam of UV light is shined through the analyte after it is eluted from the column. • A detector is positioned on the opposite side which can measure how much light is absorbed and transmitted. • The amount of light absorbed will depend on the amount of the compound that is passing through the beam. http://www.chemguide.co.uk/analysis/chromatography/hplc.html
UV/VIS Absorption Detectors • Beer-Lambert law: A=εbc • absorbance is proportional to the compound concentration. • Fixed Wavelength: measures at one wavelength, usually 254 nm • Variable Wavelength: measures at one wavelength at a time, but can detect over a wide range of wavelengths • Diode Array Detector (DAD): measures a spectrum of wavelengths simultaneously
The Fluorescence Detector • Measure the ability of a compound to absorb then re-emit light at given wavelengths • Some compounds will absorb specific wavelengths of light which, raising it to a higher energy state. • When the compound returns to its ground state, it will release a specific wavelength of light which can be detected. • Not all compounds can fluoresce / more selective than UV/VIS detection. http://mekentosj.com/science/fret/images/ fluorescence.jpg
Electrochemical Detectors (ECDs) • Electrochemical Detectors (ECDs): • Used for compounds that undergo oxidation/reduction reactions. • Detector measures the current resulting from an oxidation/reduction reaction of the analyte at a suitable electrode. • Current level is directly proportional to the concentration of analyte present. • Conductivity Detector: • Records how the mobile phase conductivity changes as different sample components are eluted from the column. http://hplc.chem.shu.edu/HPLC/index.html http://hplc.chem.shu.edu/HPLC/index.html
Types • Exclusion • Ion Exchange • Affinity • Hydrophobic interaction
1. Size Exclusion Chromatography • Size exclusion: • Sample separated based on size. • Stationary phase has specific pore sizes. • Larger molecules elute quickly. • Smaller molecules penetrate inside the pores of the stationary phase and elute later.
2. Ion Exchange Chromatography • Ion exchange: • Used with ionic or ionizable samples. • Stationary phase has a charged surface. • opposite charge to the sample ions • Cation exchange resin: sulfonic acid or –COOH • Anion exchange resin: tertiary or primary amine • The mobile phase = aqueous buffer • The stronger the charge on the analyte, the more it will be attracted to the stationary phase, the slower it will elute.
3. Affinity Chromatography • Stationary phase: covalently bonding affinity ligands to a solid support (agarose, porous glass bead) • Affinity ligands: antibodies, enzyme inhibitors, molecules that reversibly and selectively bind to analytes • Analytemolecules are retained by the stationary phase change the mobile phase to release the analyte • Mobile phase: 1. support strong bonding between analyteand the ligands. 2. eliminate the analyte ligand interaction. Change of pH or μ • A: Extraordinary specificity • Application: rapid isolation of biomolecules
Instruments • HPLC • FPLC
Stationary phase • The stationary phase or adsorbent in column chromatography is a solid. The most common stationary phase for column chromatography is silica gel, followed by alumina. Cellulose powder has often been used in the past. Also possible are ion exchange chromatography, reversed-phase chromatography(RP), affinity chromatography or expanded bed adsorption (EBA). The stationary phases are usually finely ground powders or gels and/or are microporous for an increased surface, though in EBA a fluidized bed is used. There is an important ratio between the stationary phase weight and the dry weight of the analyte mixture that can be applied onto the column. For silica column chromatography, this ratio lies within 20:1 to 100:1, depending on how close to each other the analyte components are being eluted
Mobile phase (eluent) • The mobile phase or eluent is either a pure solvent or a mixture of different solvents. It is chosen so that the retention factor value of the compound of interest is roughly around 0.2 - 0.3 in order to minimize the time and the amount of eluent to run the chromatography. The eluent has also been chosen so that the different compounds can be separated effectively. The eluent is optimized in small scale pretests, often using thin layer chromatography (TLC) with the same stationary phase. • There is an optimum flow rate for each particular separation. A faster flow rate of the eluent minimizes the time required to run a column and thereby minimizes diffusion, resulting in a better separation. However, the maximum flow rate is limited because a finite time is required for analyte to equilibrate between stationary phase and mobile phase, see Van Deemter's equation. A simple laboratory column runs by gravity flow. The flow rate of such a column can be increased by extending the fresh eluent filled column above the top of the stationary phase or decreased by the tap controls. Faster flow rates can be achieved by using a pump or by using compressed gas (e.g. air, nitrogen, or argon) to push the solvent through the column (flash column chromatography). • The particle size of the stationary phase is generally finer in flash column chromatography than in gravity column chromatography. For example, one of the most widely used silica gel grades in the former technique is mesh 230 – 400 (40 – 63 µm), while the latter technique typically requires mesh 70 – 230 (63 – 200 µm) silica gel. • A spreadsheet that assists in the successful development of flash columns has been developed. The spreadsheet estimates the retention volume and band volume of analytes, the fraction numbers expected to contain each analyte, and the resolution between adjacent peaks. This information allows users to select optimal parameters for preparative-scale separations before the flash column itself is attempted
Column Chromatogram Resolution Calculation • Typically, column chromatography is set up with peristaltic pumps, flowing buffers and the solution sample through the top of the column. The solutions and buffers pass through the column where a fraction collector at the end of the column setup collects the eluted samples. Prior to the fraction collection, the samples that are eluted from the column pass through a detector such as a spectrophotometer or mass spectrometer so that the concentration of the separated samples in the sample solution mixture can be determined. • For example, if you were to separate two different proteins with different binding capacities to the column from a solution sample, a good type of detector would be a spectrophotometer using a wavelength of 280 nm. The higher the concentration of protein that passes through the eluted solution through the column, the higher the absorbance of that wavelength.
Because the column chromatography has a constant flow of eluted solution passing through the detector at varying concentrations, the detector must plot the concentration of the eluted sample over a course of time. This plot of sample concentration versus time is called a chromatogram. • The ultimate goal of chromatography is to separate different components from a solution mixture. The resolution expresses the extent of separation between the components from the mixture. The higher the resolution of the chromatogram, the better the extent of separation of the samples the column gives. This data is a good way of determining the column’s separation properties of that particular sample. The resolution can be calculated from the chromatogram. • The separate curves in the diagram represent different sample elution concentration profiles over time based on their affinity to the column resin. To calculate resolution, the retention time and curve width are required.
Retention Time: The time from the start of signal detection by the detector to the peak height of the elution concentration profile of each different sample. • Curve Width: The width of the concentration profile curve of the different samples in the chromatogram in units of time. • A simplified method of calculating chromatogram resolution is to use the plate model. The plate model assumes that the column can be divided into a certain number of sections, or plates and the mass balance can be calculated for each individual plate. This approach approximates a typical chromatogram curve as a Gaussian distribution curve. By doing this, the curve width is estimated as 4 times the standard deviation of the curve, 4σ. The retention time is the time from the start of signal detection to the time of the peak height of the Gaussian curve.
From the variables in the figure above, the resolution, plate number, and plate height of the column plate model can be calculated using the equations: • Resolution (Rs) Rs = 2(tRB – tRA)/(wB + wA) Where: tRB = retention time of solute BtRA = retention time of solute AwB = Gaussian curve width of solute BwA = Gaussian curve width of solute APlate Number (N):N = (tR)2/(w/4)2Plate Height (H):H = L/NWhere L is the length of the column.