Download
1 / 13
130 likes | 135 Vues
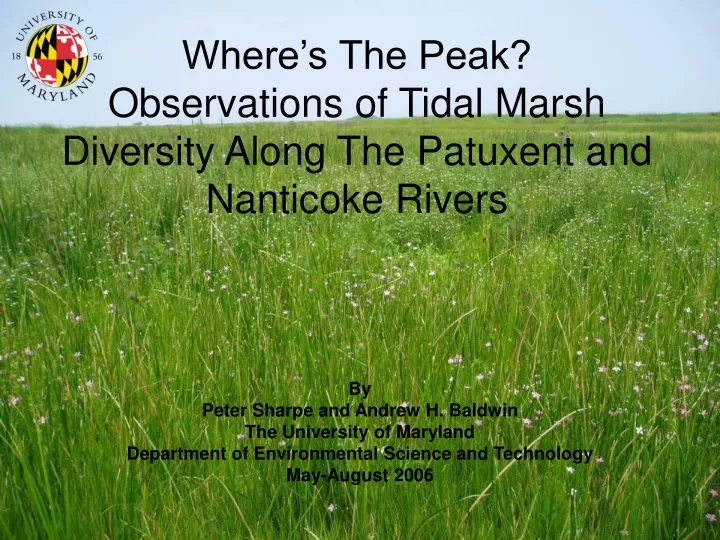
This research study examines the plant species richness in tidal marshes along the Patuxent and Nanticoke Rivers, two Chesapeake Bay tributaries. The study seeks to understand the diversity of these marshes across a salinity gradient, from fresh to brackish water. The results show that the Nanticoke River has an increase in richness up to a mean soil salinity of 3-4 ppt, while the Patuxent River maintains species richness along the gradient up to 3 ppt. The study suggests that periodic saltwater stress may promote the coexistence of freshwater and brackish species. Other factors such as soil nutrient concentrations, marsh hydroperiods, toxicants, and invasive species were also considered.

E N D
Where’s The Peak? Observations of Tidal Marsh Diversity Along The Patuxent and Nanticoke Rivers By Peter Sharpe and Andrew H. Baldwin The University of Maryland Department of Environmental Science and Technology May-August 2006
Fresh Transitional Richness Richness Brackish Salinity Salinity Research Objectives • Describe plant species richness across a salinity gradient (fresh-brackish) in tidal marshes of two Chesapeake Bay Tributaries
Patuxent River Washington D.C.
Patuxent River Watershed Features Watershed Size – 2,356 km2 Gradient Length – 47 km Mean Tidal Range at Jug Bay – 0.73 m Land Use: • 30% Agricultural • 40% Forest • 20% Urban • 10% Other Land Uses Number of Survey Plots - 13
Patuxent River Washington D.C. Nanticoke River
Nanticoke River Watershed Features Watershed Size – 2,136 km2 Gradient Length – 56 km Mean Tidal Range at Sharptown, MD – 0.76 m Land Use: • 48% Agricultural • 41% Forest • 2% Urban • 8% Other Land Uses Number of Survey Plots - 16
Patuxent and Nanticoke River Study Sites Patuxent River Gradient – 47 km Nanticoke River Gradient – 56 km Seaford, DE Jug Bay Bivalve Harbor Benedict
10 3 9 8 4 7 6 2 2 1 2 2 3 2 4 5 4 3 Methods Vegetation surveyed using nested plot design consisting of a series of 10x10 m modules (Peet et al. 1998) 20 m 50 m GPS Reading Piezometer Location SCT Reading
Low Marsh Levee High Marsh Typical Sampling Location Surveyed Area 10 m
Nanticoke River Species Richness Results (May-August) Residual Depth 1000 m2 Survey Area
Patuxent River Species Richness Results (May-August) Residuals 1000 m2 Survey Area
Conclusions • Nanticoke River data show no immediate reduction in richness, actually an increase along the Nanticoke up to mean soil salinity of 3-4 ppt (peak observed at 0.8 ppt soil salinity) • Patuxent River data show slight peak in June within limits of salt intrusion followed by maintenance of species richness along gradient up to 3 ppt • Periodic salt water stress could promote coexistence of freshwater and brackish species • Other potential factors: soil nutrient concentrations, marsh hydroperiods, toxicants, invasive species
Acknowledgements Project funding provided by the Maryland/D.C. Chapter of The Nature Conservancy through a Biodiversity Conservation Research Fund Grant Special thanks to Dr. Andrew Baldwin, Dr. David Tilley, Daniel Marcin, Robbie Vocke, Krissy Rusello, Douglas Rau, and Katherine Sharpe