Introduction to SAR Weather
370 likes | 391 Vues
Learn about atmospheric models, including the WRF model, importance of resolution, and Crisis Response System in the SARWeather project. Explore data assimilation techniques, boundary data sources, and the impact of high resolution in weather simulations.

Introduction to SAR Weather
E N D
Presentation Transcript
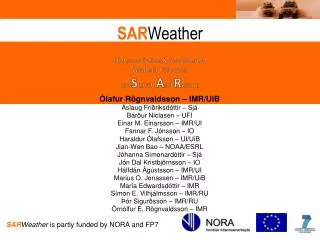
Cloud Computing Education series Introduction to SARWeather Ólafur Rögnvaldsson – IMR/Belgingur or@belgingur.is LogiRagnarsson – IMR/Belgingur logi@belgingur.is
Cloud Computing Education series Acknowledgement • SARWeather is a joint research project led by IMR/Belgingur, in collaboration with NOAA/ESRL, the University of Bergen, and the private companies GreenQloud and DataMarket. To ensure maximum usability for SAR operators, SARWeather is developed in close collaboration with ICE-SAR and the Civil Protection Department of the Icelandic Police. • SARWeather was initially funded in part by grant number 550-025 (Vejrtjeneste for Søberedskab) from NORA and by the European Commission under the 7th Community Framework Programme for Research and Technological Development (GalileoCast). GalileoCast is managed by GSA, the European GNSS Supervisory Authority. • Current development of SARWeather is funded in part by the Icelandic Technical Development Fund – RANNÍS • Development related to the SUMO has in part been funded by the COST project ES0802 SARWeather – www.sarweather.com
Cloud Computing Education series Overview • Atmospheric Models • Global vs. regional • The WRF model • Importance of resolution • Current Crisis Response System • SARWeather demonstration • Use of observations from UAS’s • Conclusions and future work SARWeather – www.sarweather.com
Cloud Computing Education series Atmospheric models Set of equations that describe the atmospheric flow and need to be integrated forward in time to produce a weather forecast Global Regional SARWeather – www.sarweather.com
Cloud Computing Education series Atmospheric models Set of equations that describe the atmospheric flow and need to be integrated forward in time to produce a weather forecast Initial and boundary data come from global models Regional SARWeather – www.sarweather.com
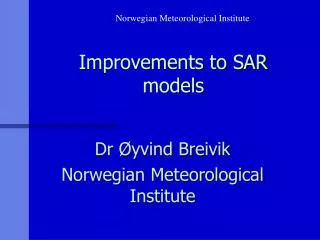
Cloud Computing Education series The WRF atmospheric model • Open source model developed in collaboration of • NCAR, NOAA, FSL, AFWA, NRL, Univ. of Oklahoma & FAA • Five development teams with sixteen workgroups • More than 160 official developer • Additional development by academic and governmental institutions in the US and abroad • Very large user community, excellent support • Non-hydrostatic • Regional and global applications • Wide range of scales for both real time and idealized applications • Optional data assimilation; 3D-VAR, 4D-VAR, EnKFM, and FDDA • Has been modified for volcanic applications • Includes a dust module (re-suspension of dust/ash) SARWeather – www.sarweather.com
Cloud Computing Education series Importance of high resolution
Cloud Computing Education series Importance of high resolution How does the weather model “see” this mountain? SARWeather – www.sarweather.com
Cloud Computing Education series Importance of high resolution Vatnajökull icecap, max height is 1675m. Top height of Mt. Öræfajökull is only 880m True height of Mt. Öræfajökull is 2119m At 1km resolution the max height is 2020m. Top height of Mt. Öræfajökull is now 1945m SARWeather – www.sarweather.com
Cloud Computing Education series Importance of high resolution 9 km resolution 10 15 20 25 30 35 40 45 m/s SARWeather – www.sarweather.com
Cloud Computing Education series Importance of high resolution 3 km resolution 10 15 20 25 30 35 40 45 m/s SARWeather – www.sarweather.com
Cloud Computing Education series Importance of high resolution 1 km resolution
Cloud Computing Education series Simulation results are also affected by the choice of parameterization schemes Rögnvaldsson, Ó., Bao, J.-W., Ágústsson, H., and Ólafsson, H.: Downslope windstorm in Iceland – WRF/MM5 model comparison, Atmos. Chem. Phys., 11, 103-120, doi:10.5194/acp-11-103-2011, 2011. SARWeather – www.sarweather.com
Cloud Computing Education series Importance of high resolution How is the wind flow over this mountainous peninsula simulated at 9 and 1 km resolution? SARWeather – www.sarweather.com
Cloud Computing Education series Importance of high resolution Very high resolution – 1 km When model resolution is increased to 1 km the true complexity and strength of the wind field becomes apparent Medium resolution – 9 km SARWeather – www.sarweather.com
Cloud Computing Education series Why not always use 1km resolution? Need 1000-times more CPU power to simulate a 1 km resolution forecast than a 10 km one for the same region! SARWeather – www.sarweather.com
Cloud Computing Education series What if • You only need high very high resolution once in a while? • Computer clouds (e.g. Azure, EC2 and GreenQloud) are starting to offer HPC service • Offers great scalability • Relatively cheap • And there is already a solution out there SARWeather – www.sarweather.com
Cloud Computing Education series Crisis Response System • Quality weather information help improve decision making • Current CRS uses the WRF model and consists of a • Backend andFrontend • Frontend is called SARWeather • Easy to use • Fast • Flexible model output and presentation • CF and ArcGIS compliant output files • Interactive and static maps SARWeather – www.sarweather.com
Cloud Computing Education series High resolution not always sufficient Simulated and observed surface winds on 15 July 2009 at 15 UTC Model simulates a see-breeze that is not seen in observations WRF at a resolution of 500 m forced with ECMWF-data on model levels. Observed surface winds in red Mt. Esja SARWeather – www.sarweather.com
Cloud Computing Education series SUMO and WRF Can be operated in cold climates The SUMO (Small Unmanned Meteorological Observer) can measure winds, humidity, pressure, and temperature in a vertical profile up to a 4km height SARWeather – www.sarweather.com
Cloud Computing Education series SUMO and WRF This data can be assimilated with the WRF weather forecast SARWeather – www.sarweather.com
Cloud Computing Education series SUMO and WRF The SUMO-data is incorporated into the WRF-simulation, via obs-nudging SARWeather – www.sarweather.com
Cloud Computing Education series Effects of additional observations Simulated and observed surface winds on 15 July 2009 at 13 UTC The flow structure is now in much better agreement with available observations WRF at a resolution of 500 m forced with ECMWF-data on model levels and SUMO data Observed surface winds in red SARWeather – www.sarweather.com
Cloud Computing Education series Effects not just at the surface Simulated flow in N-S section across Mt. Esja A major difference in flow pattern extending far above mountain top leve Wind speed, ranging from 0 to 12 m/s 23 km SARWeather – www.sarweather.com
Cloud Computing Education series Effects can be far reaching “Substantial improvements of winds, temperatures and humidity in the region are achieved” CTRL - ObsNudge Marius O. Jonassen, HaraldurÓlafsson, HálfdánÁgústsson, Ólafur Rögnvaldsson, and Joachim Reuder (2012). Improving a high resolution numerical weather simulation by assimilating data from an unmanned aerial system. Accepted for publication inMonthly Weather Review SARWeather – www.sarweather.com
Cloud Computing Education series Transmitting data from the field Observations made over Myrdalsjokull ice cap in South Iceland on 17 May 2012 Data can be transmitted via 3G mobile connection One profile used for comparison at 16:30 UTC Three profiles used to nudge the forecast at times 11:55, 12:58 and 14:38 UTC Site altitudes ~ 1300 m.a.s.l. Profile heights ~ 2000 m.a.g.l. From 860hPa to 650/680hPa SARWeather – www.sarweather.com
Cloud Computing Education series Transmitting data from the field Observations made over Myrdalsjokull ice cap in South Iceland on 17 May 2012 Obs in black WRF - noSUMO in red WRF - withSUMO in blue Profile used for nudging @ 14:38 UTC 750 hPa Wind-speed Temperature Profile used for comparison @ 16:30 UTC 850 hPa -20°C -10°C 0°C 5m/s 10m/s 750 hPa Wind-speed Problems with low-level windspeed and a cold bias 2hrs after last profile Temperature 850 hPa SARWeather – www.sarweather.com -20°C -10°C 0°C 5m/s 10m/s
Additional sensors Cloud Computing Education series The SUMO has been equipped with an optical dust sensor • GP2Y1010AU0F is a dust sensor by optical sensing system: • An infrared emitting diode (IRED) and an phototransistor are diagonally arranged into the device • It detects the reflected light of dust in air • Especially effective to detect very fine particle • In addition it can distinguish smoke from house dust by pulse pattern of output voltage Saturation at about 500μg/m3 SARWeather – www.sarweather.com
Preliminary results Cloud Computing Education series The SUMO dust sensor has been tested in France and Iceland SARWeather – www.sarweather.com
Preliminary results Cloud Computing Education series The SUMO dust sensor has been tested in France and Iceland Ascending Descending Sensor is now being calibrated and tested with ash from Mt. Eyjafjallajökull SARWeather – www.sarweather.com
Calibration – preliminary results Cloud Computing Education series • The sensor (BU) readings show high sensitivity in the range 125 – 300. After that the sensitivity is rather low in the range 350 to 700. • Using the meter for ash surveillance for jet aircrafts, the best thing would be to designate below 300 as “safe” but above 400 as “unsafe” SARWeather – www.sarweather.com
Cloud Computing Education series Various uses of model output To correctly simulate distribution of pollutants, it is very important to correctly simulate the atmospheric conditions close to the source. Data courtesy of Prof. Saji Hameed at the University of Aizu, Fukushima. SARWeather – www.sarweather.com
Cloud Computing Education series Various uses of model output Output from SARWeather could also be used as input to coastal waves and circulation and storm surge models such as the coupled SWAN+ADCIRC system Simulated maximum water level for hurricane Gustav, September 2008. Taken from www.adcirc.org SARWeather – www.sarweather.com
Cloud Computing Education series Current research and development Misc. datasources (optional) SARWeather – www.sarweather.com
Cloud Computing Education series Current research and development SARWeather – www.sarweather.com
Cloud Computing Education series Conclusions • Model resolution is important • Especially in the vicinity of complex terrain • On-Demand CR system has been developed • Called SARWeather– www.sarweather.com • Data from SARWeathercan be used as a driver for a number of other modeling systems • Additional observations can improve the simulation • Vertical profiles made by the SUMO, radiosondesor other means • The SUMO is a low-cost system with many advantages • Proof of concept before investing in a more durable and expensive UAS • Additional sensors are being added to the system • Is currently being integrated to the SARWeather CR system SARWeather – www.sarweather.com
Cloud Computing Education series Future work, collaboration? • Continue improving usability • Re-occurring forecasts • Add output at different vertical levels • Add weather parameters for aviation • Visibility, icing potential, turbulence severity • Better support for mobile devices • Location based services • Add support for different modeling systems, e.g. • Dispersion models • Wave and storm surge models • Flash-flood modeling • What would you like to see? • Interest in developing add-on solutions for SARWeather? SARWeather – www.sarweather.com