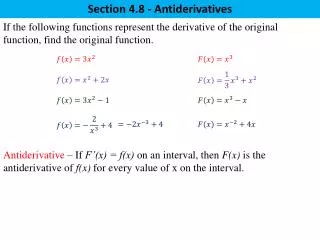
Understanding Antiderivatives and Distance Traveled Using Velocity Curves
This section explores the concept of antiderivatives graphically and numerically, focusing on velocity curves measured in ft/sec. We examine how to calculate the distance traveled in specific time intervals, such as between 0 to 2 seconds and 2 to 4 seconds, using the area under the velocity curve. By employing the Fundamental Theorem of Calculus, we demonstrate how to find the net area under these curves, revealing the relationship between velocity and distance. This exercise culminates in estimating function values from given derivatives.

Understanding Antiderivatives and Distance Traveled Using Velocity Curves
E N D
Presentation Transcript
The following is a velocity curve in ft/sec • How would we find the distance traveled between 0 and 2 seconds?
The following is a velocity curve in ft/sec • How would we find the distance traveled between 2 and 4 seconds?
The following is a velocity curve in ft/sec • How would we find the total distance traveled in the first 4 seconds?
The following is a velocity curve in ft/sec • Thus we can use the area under the curve to give us the change in function values
In the last section we began discussing area under a curve • If we had a velocity curve than the area under the curve gave us the distance traveled • We introduced the definite integral as a way of finding the net area under a curve • The net area under the curve gives us the change in the function value from a to b • We are going to use this information to see how we can recover function values give the derivative
Complete the worksheet • Find the area under f’ between 0 and 3 • Now use the Fundamental Theorem of Calculus to get the area under each graph you found between 0 and 3 • f and g are called antiderivatives of f’ • They have the same derivative, although they are different functions
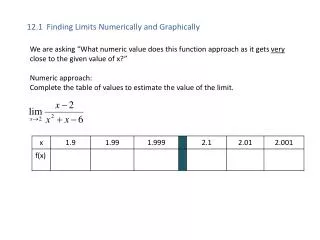
Given the values of the derivative, f’(x) in the table and that f(0) = 100, estimate f(x) for x = 2, 4, 6.