Download
1 / 23
230 likes | 319 Vues
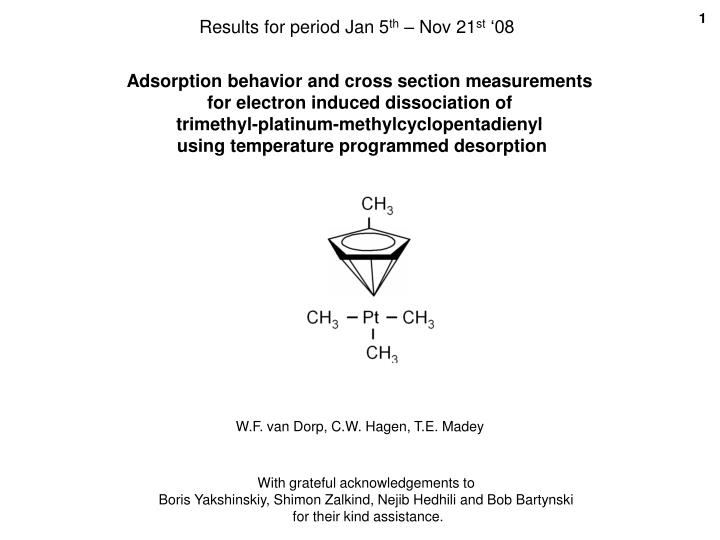
Results for period Jan 5 th – Nov 21 st ‘08. Adsorption behavior and cross section measurements for electron induced dissociation of trimethyl-platinum-methylcyclopentadienyl using temperature programmed desorption. W.F. van Dorp, C.W. Hagen, T.E. Madey.

E N D
Results for period Jan 5th – Nov 21st ‘08 Adsorption behavior and cross section measurements for electron induced dissociation of trimethyl-platinum-methylcyclopentadienyl using temperature programmed desorption W.F. van Dorp, C.W. Hagen, T.E. Madey With grateful acknowledgements to Boris Yakshinskiy, Shimon Zalkind, Nejib Hedhili and Bob Bartynski for their kind assistance.
Contents Contents 1. Mass spectrum 2. Adsorption behavior 3. Cross sections for electron induced dissociation 4. Measurement of total PE current 5. Measurement of SE yield from sample 6. Relative contributions of SE’s to total cross section at 150, 500 and 1000eV 7. Suggested content for manuscripts
1. Mass spectrum Procedure 1. Backfill UHV chamber with precursor gas to a pressure of ~10-8 Torr 2. Switch on mass spectrometer 3. record spectrum
1. Mass spectrum Interpretation All major fragments can be identified, except for the parent molecule. The parent molecule has m/z = 319, which is beyond the limit of the UTI 100C QMS. Fragment m/z = 289 is used for all subsequent TPD studies.
2. Adsorption behavior Procedure Comment: Heating rate is 2 to 3 K s-1.
clean Au(110) 2. Adsorption behavior 2 1 Interpretation The TPD spectrum is typical for 1st order adsorption behavior. There are 2 distinct peaks in the spectra (peak 1 and peak 2). The first monolayer in direct contact with the Au substrate (peak 1) has a higher desorption temperature than the layer(s) adsorbed onto the first monolayer (peak 2). Furthermore, peak 2 does not form until peak 2 is saturated. This indicates that the molecule adsorbs and desorbs molecularly.
C/Pt layer on top of Au sample 2 1 2. Adsorption behavior Interpretation When the Au sample is covered in a thick Pt/C layer (formed by dissociating tens of monolayers of adsorbed precursor), the adsorption behavior is qualitatively the same. Multilayers do not form until the first monolayer is fully complete. Again, adsorption and desorption behavior is molecular.
3. Cross sections for electron induced dissociation Procedure Comment: I try to make the current density distribution as uniform as possible over the sample (by defocussing and scanning the beam).
3. Cross sections for electron induced dissociation C/Pt layer on top of Au sample Interpretation The TPD spectrum as function of electron dose. As the electron dose (linear with irradiation time) increases, the area under the TPD spectrum decreases. This decrease can be used to calculate the cross section for dissociation. It is not clear why a second peak develops in the TPD spectrum at high electron doses.
3. Cross sections for electron induced dissociation Interpretation The measured cross section as function of the incident electron energy. There is a threshold at 2eV and probably a resonance at around 14.5eV. The cross section on the clean Au is considerably lower than the cross section on the C/Pt covered surface. This is probably due to quenching: the lifetime of an electronic resonance or excitation is shorter when the precursor molecules are closer to the metal substrate (i.e. when there is no C/Pt layer).
3. Cross sections for electron induced dissociation Interpretation The TPD measurements of the cross section on the clean Au at Rutgers compare very well to the cross sections measured with XPS and MS at Johns Hopkins University.
3. Cross sections for electron induced dissociation Interpretation Aurelien Botman [1] has used an SEM to measure the deposition yield as function incident electron energy. Qualitatively speaking, the trend between his measurements and the TPD measurements is the same. Making further comparisons is difficult, because the systems, operating conditions and techniques were quite different. [1]: submitted, to appear in the dec issue of JVST B (2008).
4. Measurement of total PE current Procedure 1. Focus e-beam to smallest spot size. 2. Measure profile and current of incident primary electron (PE) beam by moving Faraday cup up and down in z-direction z e-gun A beam limiting aperture with area Aaperture inside vacuum outside vacuum 3. Fit a 2D Gaussian distribution to the beam profile. 4. Calculate the total PE current in the entire e-beam by assuming that the beam is rotationally symmetric, so that the fitted 2D Gauss is representative of a 3D Gauss. The volume under a 3D Gauss is calculated with: Itotal = 2πσxσy Jpeak with σ = [cm] (equation 1) with Jpeak = Ipeak/Aaperture, with Ipeak = [A], Jpeak = [A cm-2], Aaperture = [cm-2] (equation 2) .
4. Measurement of total PE current EPE = 150eV Assuming the fitted 2D Gauss is rotationally symmetric, the total current in the PE beam Itotal = -3.7 10-6 [A]. Interpretation PE currents are 3.7 10-6 A (150eV), 4.7 10-6 A (500eV) 5.6 10-6 A (1000eV) and are very constant in time. When focused, the beam is smaller than the size of the sample (sample diameter = 1 cm).
5. Measurement of SE yield from sample Procedure 1. Leave beam unmodified from measurement with Faraday cup (i.e. beam position, beam focus, etc. are identical). Put sample in the beam instead of Faraday cup. 2. Bias the sample positively with voltages between 0 and +50V. This recollects all SE’s with energies between 0 and Vbias. Measure Isample at every bias voltage. 3. At each bias, the source potential Esource is adjusted to compensate for the additional acceleration energy gained as result of the bias. So at a bias of Vbias = +10V, the source is set to Esource = -140eV so that the EPE (at the sample) = Esource - Vbias = -150eV. Source filament Au sample Picoammeter Positive bias ESE < Vbias -140eV +10V A ESE > Vbias Interpretation With these experiments, it’s assumed that: The SE’s with E>Vbias (blue arrows) escape into vacuum. The SE’s with E<Vbias (green arrows) are recollected and contribute to the measured Isample. The measured currents are very reproducible.
5. Measurement of SE yield from sample Pt/C covered sample PE currents: 150eV: 3.7 10-6 A 500eV: 4.7 10-6 A 1000eV: 5.6 10-6 A Pt/C covered sample Interpretation On the Pt/C covered surface, all sample currents are low (0 to +200nA) at 0V bias. As the bias increases, the sample current goes to about -1 10-6 A. This is low compared to the incident beam currents. Perhaps the BSE currents (not measured in these experiments) are very large. The bottom graph is the derivative of the top graph.
5. Measurement of SE yield from sample Clean Au PE currents: 150eV: 3.7 10-6 A 500eV: 4.7 10-6 A 1000eV: 5.6 10-6 A Clean Au Pt/C covered sample Interpretation The difference in SE emission between 150eV and 1000eV is larger on the clean Au substrate than on the Pt/C covered substrate. For the rest, the trend is the same: the measured currents are low compared to the incident PE current and as the bias increases, the sample current goes to about -1 10-6 A. The bottom graph is the derivative of the top graph.
6. Relative contributions of SE’s to total cross section at 150, 500 and 1000eV Procedure (1) The growth rate (or the dissociation rate) for electron induced deposition can be defined as: R = Vmolecule σ(E) N J (equation 3) with R = [cm s-1], Vmolecule = [cm3], σ(E) = [cm2], N = [cm-2] and J = [A cm-2] The number of dissociated molecules per second, Ndiss, can then be defined as: Ndiss = R / (Vmolecule N) = σ(E) J (equation 4) with Ndiss = [s-1]
6. Relative contributions of SE’s to total cross section at 150, 500 and 1000eV Procedure (2) If we assume (whether justified or unjustified) that primary electrons with energies 0eV < EPE < 50eV do not generate any SE’s, than we can assume that: Jtotal = JPE (equation 5) σ(E), measured = σ(E), total (equation 6) For primary electrons with energies >50eV, we can assume: Jtotal = JPE + JBSE + JSE (equation 7) σ(E) total = σ(E) PE + σBSE + σSE (equation 8) At those energies, the PE’s generate a spectrum of BSE’s and SE’s. JPE JPE JBSE JSE JBSE JSE 0 < EPE < 50eV no SE’s or BSE’s, just PE’s. EPE > 50eV PE’s, BSE’s and SE’s
6. Relative contributions of SE’s to total cross section at 150, 500 and 1000eV Procedure (3) With the measured SE yields at specific PE energies, we can find the relative contribution of SE’s to Ndiss: for 0eV < EPE < 50eV: Ndiss = σ(E), measured JPE for >50eV: Ndiss = (σ(E), measured JPE) – Σ(σ(E), SE JSE)
6. Relative contributions of SE’s to total cross section at 150, 500 and 1000eV Interpretation The measured electron currents superimposed on the cross section data. It shows clearly how low the SE current is compared to the incident PE current.
6. Relative contributions of SE’s to total cross section at 150, 500 and 1000eV Interpretation If the measurements of the SE and PE currents are correct, the contribution of the SE’s to the total amount of dissociated material is negligible. PE’s (and possibly BSE’s) contribute ~1000 times more to the dissociation than the SE’s. Although slightly surprising, this is consistent with the observation made by Josh, Justin and Howard at Johns Hopkins that x-rays (which generate a lot of SE’s) are not damaging an adsorbed layer of precursor at all.
7. Suggested content for manuscripts The following is a possible way to present the data in manuscripts. If we do it like this, we present some data more than once, which is not ideal. On the other hand, there is too much unpublished data to put into one single paper, the paper would become impossible to read. When we clearly indicate the overlap/relationship between the 5 manuscripts (the one already submitted to J Phys Chem by Josh, Justin and Howard at JHU, the one submitted to JVST by Aurelien Botman and the 3 manuscripts described below), it will present a impressive set of work. Provided everyone agrees, of course. Contents of manuscript 1 (co-authors with Josh, Justin and Howard from JHU): - All TPD data: - adsorption behavior on clean Au (already submitted to J Phys Chem by Josh, Justin and Howard) - adsorption behavior on Pt/C covered surface - cross section measurements - XPS and MS data from Josh, Justin and Howard. - deposition yield data from Aurelien Botmans experiments?? (already submitted to JVST B) Contents of manuscript 2: - PE/SE current measurements - relative contribution from PE’s and SE’s to total cross section. Contents of manuscript 3 (co-authors with Nejib, Andrew and Leon Sanche?): - H- yields as function of energy, measured by Nejib Hedhili and Andrew Bass in Sherbrooke. - cross section as function of energy, measured with TPD. We have to look at it more carefully, but perhaps we can correlate the resonance at 11eV observed with the H- yields to the resonance at 14.5 eV observed with the TPD measurements. If so, it would make sense to publish this as a separate paper.