
Uploaded by
dean
11 SLIDES
310 VUES
110LIKES
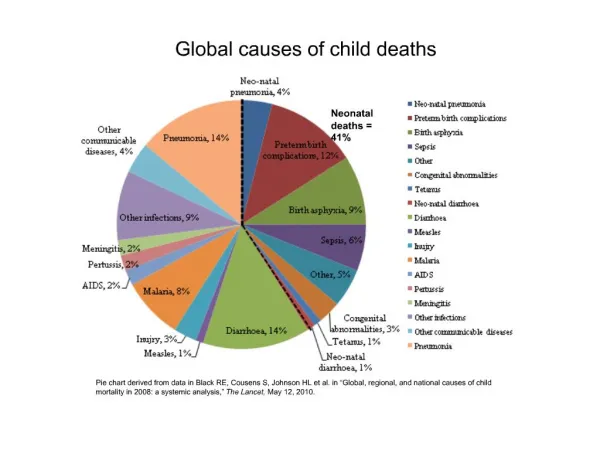
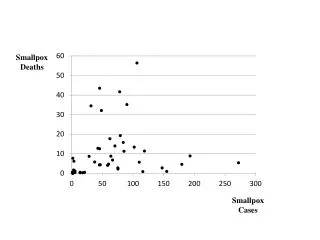
### Understanding Key Figures and Trends in Mortality Data ###
DESCRIPTION
Chapter 3 explores crucial statistics related to mortality, illustrated by Figures 3.3, 3.6, 3.7, and 3.10. Each figure provides insight into different aspects of death rates, demographic influences, and changes over time in mortality patterns. The analysis helps to identify trends and contributing factors associated with deaths in specific populations. A closer examination of these figures is essential for public health strategies, policy-making, and understanding the broader implications of mortality data. ###
Download

1 / 11
Télécharger la présentation 
### Understanding Key Figures and Trends in Mortality Data ###
An Image/Link below is provided (as is) to download presentation
Download Policy: Content on the Website is provided to you AS IS for your information and personal use and may not be sold / licensed / shared on other websites without getting consent from its author.
Content is provided to you AS IS for your information and personal use only.
Download presentation by click this link.
While downloading, if for some reason you are not able to download a presentation, the publisher may have deleted the file from their server.
During download, if you can't get a presentation, the file might be deleted by the publisher.
E N D


More Related