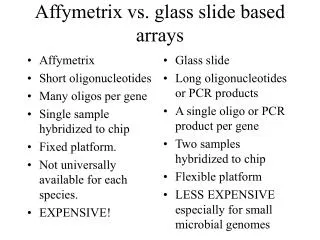
Evaluation of Affymetrix Array Normalization Strategies Using Spiked cRNAs in C. elegans
260 likes | 406 Vues
This study evaluates various normalization procedures for Affymetrix GeneChip data using the C. elegans array dataset as a testbed. By profiling 8 developmental stages of C. elegans across 52 total arrays, we address challenges in array data reduction and examine methods such as GeneChip Scaled Average Difference and spike-based normalization strategies. Our findings highlight the strengths and limitations of different normalization approaches, emphasizing the importance of calibration and consistency in cRNA quantitation for accurate expression analysis.

Evaluation of Affymetrix Array Normalization Strategies Using Spiked cRNAs in C. elegans
E N D
Presentation Transcript
Evaluation of Affymetrix array normalization procedures based on spiked cRNAs Andrew Hill Expression Profiling Informatics Genetics Institute/Wyeth-Ayerst Research
Outline • The GI/Harvard C. elegans array dataset as a normalization testbed • Some general challenges of array data reduction • GeneChip Scaled Average Difference (ADs) • the constant mean assumption • A purely spike-based normalization strategy (Frequency) • A hybrid normalization (Scaled Frequency) • Conclusions
GI/Harvard C. elegans dataset • This data set used to evaluate several normalization procedures • Experiments: • 8 developmental stages of the worm C. elegans were profiled, ranging from egg to adult worm • n=2-4 replicate hybridizations for most array designs at most stages • 52 total arrays • Arrays: • Three custom worm GeneChip designs (A, B, and C) • Each array monitors between 5700-6700 ORFs, in aggregate ~98% of the worm genome • Chip A: ORFs with cDNA/EST matches in AceDB • Chips B/C: other ORFs • Several worm ORFs tiled on all 3 arrays for across-array-design comparisons Science 290 809-812; Genome Biology (in the press)
Some challenges of Affymetrix GeneChip data reduction • Array data from Affymetrix GeneChip sofware (pre-MAS 5.0): • negative low intensity signals • lack of across-design normalization standard • limited QC information • Spike-based normalization methods can help to address each of these challenges Normalization: array scaling of average difference data from multiple arrays/designs to minimize technical noise among arrays • Current “standard” normalization procedure is a global scaling procedure: the GeneChip scaled average difference (ADs)
GeneChip Scaled Average Difference (ADs) • The trimmed (2%) mean intensity of all probesets on all arrays is scaled to a constant target level. • Works well in many cases (e.g. replicates) • Some obvious situations where the “constant mean assumption” may not be well supported.
Constant mean assumption: problematic cases • Chips monitoring a “small” fraction of transcriptome • Non-random gene selection on arrays (e.g. C. elegans A vs. B/C) • Large biological variation in expression
A cRNA spike-based normalization procedure (Frequency) • Add 11 biotin-labeled cRNA spikes to each hybridization cocktail • Construct a calibration curve • Use the Absent/Present calls for the spikes to estimate array sensitivity • Dampen AD signals below the sensitivity level to eliminate negative AD values.
Response to spikes over 2.5 log range Figure 2 • Fit response with S-plus GLM, gamma error model, zero intercept. • Power law fit AD=kFn yields n=0.93 • cRNA mass, scanner PMT gain are important determinants of response
Chip sensitivity calculation • Consider A/P calls as binary response against log(known frequency) • Compute sensitivity as 70% likelihood level by either interpolation or logistic regression • “Dampen” computed frequencies below sensitivity: • F < 0: F’ = avg(0,S) • 0<F<S: F’=avg(F,S)
Example of spike-skewed hybridization (36 hr sample) • cRNA spikes are well normalized at the expense of worm genes • Suggests inconsistency between ratio of spikes to worm cRNA across samples: spike skew
Sources of spike skew • Actual concentration of spikes may not be nominal due to variation in cRNA “purity” • Causes: liquid handling of small microlitre volumes, side reactions in cDNA/IVT process produce UV-absorbing, non-hybridizable contaminants • Result: random per-hybe noise term introduced into normalized frequencies
An alternative hybrid normalization: Scaled frequency (Fs) • Need to reduce or eliminate spike skew as a source of experimental variation in normalized frequencies • Average the globally scaled spike response over a complete set of arrays
Scaled frequency description • Define a set of arrays • Compute ADs for all arrays • Pool spike responses and fit single model to pooled response • Calibrate all arrays with single calibration factor • Compute array sensitivity and dampen frequencies as in the frequency approach.
A pooled, scaled spike response • Fit response with S-plus GLM, gamma error model, zero intercept.
Scaled frequency: cross design reproducibility (A,B,C arrays) Three messages tiled on all array designs and called Present on all 0h arrays
Conclusions • Array response to spiked cRNAs can be close to linear over 2.5 logs of concentration. • A chip sensitivity metric can be computed from Absolute Decisions associated with spikes; a very useful QC metric. • Normalization based only on spikes performs inconsistently in some cases due to ill-quantitation of cRNAs, but can still be valuable when constant-mean assumption is violated. Better cRNA quantitation and process control will help. • A hybrid approach based on global scaling and spikes performs the same as global AD scaling for single designs, and also allows cross-design comparisons
Acknowledgements • Donna Slonim • Maryann Whitley • Yizheng Li • Bill Mounts • Scott Jelinsky • Gene Brown • Harvard University: • Craig Hunter • Ryan Baugh
Simulations (description) • Simulations were performed • Governing equation:
Figure 4 CV characteristics of simulated data
Simulations: spike skew degrades reproducibility of frequency (A array)
Figure 7 Simulations: spike skew degrades accuracy of frequency