Prof. Dr. Andrey A.Konoplyanik ,
340 likes | 524 Vues
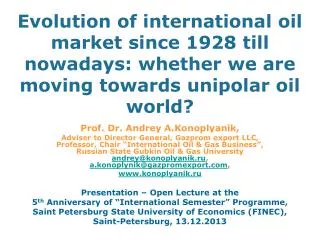
Evolution of international oil market since 1928 till nowadays: whether we are moving towards unipolar oil world?. Prof. Dr. Andrey A.Konoplyanik ,

Prof. Dr. Andrey A.Konoplyanik ,
E N D
Presentation Transcript
Evolution of international oil market since 1928 till nowadays: whether we are moving towards unipolar oil world? Prof. Dr. Andrey A.Konoplyanik, Adviser to Director General, Gazprom export LLC, Professor, Chair “International Oil & Gas Business”, Russian State Gubkin Oil & Gas Universityandrey@konoplyanik.ru,a.konoplynik@gazpromexport.com, www.konoplyanik.ru Presentation – Open Lecture at the 5thAnniversary of “International Semester” Programme,Saint Petersburg State University of Economics (FINEC), Saint-Petersburg, 13.12.2013
Chart of crude oil prices since 1861 Crude oil historical price peaks Achnaccarry Agreement 1928 A.Konoplyanik, FINEC, SPB, 13.12.2013
Table of contents • Energy markets: general trends & evolution curves, contractual structures & pricing mechanisms (author’s economic interpretation of Hubbert’s curves) • International oil: five stages of global oil market development since 1928 • 2000-ies: new stage in oilpricing • Role of some market players (Saudi Arabia, USA, Russia) A.Konoplyanik, FINEC, SPB, 13.12.2013
Marion KingHubbert & Hubbert’s curve(s) • «Hubbert’s curve» is an illustration of the theory that production profile of non-renewable energy resource within time-frame is close to normal distribution curve. Was first published by M.K.Hubbert, then geophysicist of Shell Oil Company, in “Energy from Fossil Fuels” article in “Science” magazine on February 4th, 1949. Using his model, M.K.Hubbert had predicted that US oil production will peak about 1970 what has happened later in practice, though he has predicted that world oil production will peak around 2000 (with then available resource base) which has not happened yet. This made Hubbert’s theory very popular and since then being implemented very broadly, sometimes rather straightforwardly. «Hubbert’s curve» is broadly used in scientific and pseudoscientific circles to predict limitation of resource use and their depletion. This curve is the main component of “peak oil theory” which heat up concerns as if soon depletion of [existing] oil resources (reserves). From my view, “Hubbert’s peak” is a “sliding target” that constantly moves in upward-right direction A.Konoplyanik, FINEC, SPB, 13.12.2013
Deep horizons, deep offshore, Arctic, shale gas, CBM, CSM, CMM, tight gas, gas hydrates, etc… Oil & Gas Hubbert’s curves: upward-right supply peaks steady movements Deep horizons, deep offshore, Arctic, heavy oil, shale oil, tar sands, GTL, CTL, XTL, etc… Legend: CBM = coalbed methane (from unmined rock), CSM = coalseam methane (from active coal mines), CMM = coalmine methane (from abandoned coal mines), GTL = gas-to-liquids, CTL = coal-to-liquids, XTL = biomass to liquids We will not reach Hubbert’s peaks in O&G at least within TWO INVESTMENT CYCLES (first - based on currently commercialized technologies, second – based on those yet not commercialized technologies that are currently at R&D stage) A.Konoplyanik, FINEC, SPB, 13.12.2013
Evolution of oil & gas markets: correlation of development stages, contractual structures, pricing mechanisms on the left (upward-growing) wing of Hubbert’s curve Paper energy (oil, gas) market(s) Physical energy (oil, gas) market(s) Through two investment cycles we will leave within left (upward-growing) wing of Hubbert’s O&G curves In addition – not instead to !!! =>increasing competitive choice for market players through value chain & dynamic balancing A.Konoplyanik, FINEC, SPB, 13.12.2013
Evolution of oil & gas markets: correlation of development stages, contractual structures, pricing mechanisms on the left (upward-growing) wing of Hubbert’s curve (2) Paper energy (oil, gas) market(s) Physical energy (oil, gas) market(s) Long-term contracts + cost-plus pricing => lower investment price (physical market) … plus Futures contracts + futures pricing (exchange) => trade price (paper market) … plus Spot contracts + spot pricing (OTC) => trade price (physical market) … plus Long/medium/short-term contracts + replacement value pricing => upper investment price (physical market) The principle: in addition to – not instead of!!! A.Konoplyanik, FINEC, SPB, 13.12.2013
Evolution of oil market: volumes of trade vs. volumes of physical supplies Long-term contracts Spot deals Forward deals (2) (*) Forward deals (1) (*) Futures & options Short-term contracts ? Volume of trade correspondsto volume of supplies Volume of tradeexceedsvolume of supplies=>OTC market (subsequent re-sales of non-unified commercial batches – “daisy chains”) Volume of trademultiply exceedsvolume of supplies=>liquid marketplaces/exchanges (multidirectional re-sales of unified supply liabilities) Increasing liquidity, but alsogrowing market instability =>good for traders/speculators, but is short-term & deprives project financing Markets of physical goods (of “physical” oil) Financial markets (of “paper” oil) (*) (1) within the limits of coverage by accumulated volumes of stocks, (2) beyond such limits A.Konoplyanik, FINEC, SPB, 13.12.2013
Table of contents • Energy markets: general trends & evolution curves, contractual structures & pricing mechanisms (author’s economic interpretation of Hubbert’s curves) • International oil: five stages of global oil market development since 1928 • 2000-ies: new stage in oilpricing • Role of some market players (Saudi Arabia, USA, Russia) A.Konoplyanik, FINEC, SPB, 13.12.2013
Five periods of global oil market development and their major characteristics– periods 1 & 2 A.Konoplyanik, FINEC, SPB, 13.12.2013
Mechanism of “single base pricing” at international oil market in 1928-1947 (notional figures) A.Konoplyanik, FINEC, SPB, 13.12.2013
Mechanism of “double base pricing” at international oil market in 1947-1971 (notional figures) A.Konoplyanik, FINEC, SPB, 13.12.2013
Five periods of global oil market development and their major characteristics – period 3 A.Konoplyanik, FINEC, SPB, 13.12.2013
Dominant role of spot prices in international oil trade as a basis for OPEC OSS formation during 1970-ies - 1980-ies– period 3 A.Konoplyanik, FINEC, SPB, 13.12.2013
Five periods of global oil market development and their major characteristics – period 4 A.Konoplyanik, FINEC, SPB, 13.12.2013
Evolution of pricing systems in international oil trade – periods 1-4 Futures prices dominate oil market, but NOT used by oil companies as benchmarks for project financing any more => ‘oil price’ is NOT a signal for long-term oil development A.Konoplyanik, FINEC, SPB, 13.12.2013
Five periods of global oil market development and their major characteristics – period 5 A.Konoplyanik, FINEC, SPB, 13.12.2013
Evolution of pricing mechanisms at international oil market A.Konoplyanik, FINEC, SPB, 13.12.2013
Legend to Figure PCIF(net forward) - price CIF (at importer end) calculated as cost-plus; PFOB (Mex.Gulf) - price FOB (at supplier end) in the Mexican Gulf area; Freight fict. (Mex.Gulf) – freight rates for fictitious oil deliveriesfrom Mexican Gulf area to importers; Freight real (Mex.Gulf), Freight real (Pers.Gulf) – freight rates for real oil deliveries from Mexican and Persian Gulf areas; PFOB (OPEC OSP) – OPEC official selling prices FOB; Freight real (OPEC) – freight rates for real oil deliveriesfrom OPEC member-states to importers; PFOB (netback) - price FOB, calculated as netback price (price CIF less transportations costs); Ц CIF (exchange) - price CIF as exchange quotations (at consumer end); Freight real – freight rates for real oil deliveries to importers from production areas. A.Konoplyanik, FINEC, SPB, 13.12.2013
Table of contents • Energy markets: general trends & evolution curves, contractual structures & pricing mechanisms (author’s economic interpretation of Hubbert’s curves) • International oil: five stages of global oil market development since 1928 • 2000-ies: new stage in oilpricing • Role of some market players (Saudi Arabia, USA, Russia) A.Konoplyanik, FINEC, SPB, 13.12.2013
2000-ies: new stage in oilpricing => key changes • Supply-side: Underinvestment of the 1990-ies =>cost increase since early 2000-ies + decrease in spare production capacities • Demand-side: China, India, etc. – accelerated demand growth (since 2003) + accumulation of strategic petroleum reserves in developed countries (USA), China • Institutional-side: Abolition of Glass-Stegal Act (1999) + USCommodity Futures Modernization Act (CFMA) (Dec. 2000) • Operational-side: Evolution of commodities (exchange, futures) trade: • Internet + IT technologies =>electronic marketplaces/trading floors(IPE=>ICE=>end of voice floor trading) =>robotization of electronic trading => increase in amount of traders + ease of market entry • Decrease of USD exchange rate (increase of oil import =>increase in trade & budget deficit) =>appearance of index oil funds=>expansion of possibilities for financial investments in oil-related instruments + hedging against fall of USD rate • Globalization of financial operations => ease of horizontal financial flows from/to financial (non-oil) sectors into/from paper oil market • Ease of financial investments into oil market (derivatives on derivatives) => “Belgian dentist” as key private (non-institutional) financial investor at the paper oil market • Oil-linked derivatives of index funds become the new class of financial assets aimed at compensating, inter alia, from fall of USD exchange rate • Switch of oil pricing from physical market (supply/demand of physical oil) – to paper market (supply/demand of oil-related financial derivatives) A.Konoplyanik, FINEC, SPB, 13.12.2013
Characteristics of spot, forward, futures, options deals Why such changes became possible? There is NO obligation for physical supplies under paper oil contracts (financial derivatives) !!! Source: Putting a PRICE on Energy: International Pricing Mechanisms for Oil & Gas. – ECS, 2007, p. 81 A.Konoplyanik, FINEC, SPB, 13.12.2013
Paper oil market: key players • Hedgers(since 1980’s): • Usually producers/consumers of physical goodsusing futures (financial) markets to mitigate price risks • NYMEX: 1978 – LFO, 1983 – WTI • IPE: 1988 – Brent => today crude of reference of appr. 2/3 of internationally traded oil • Oil speculators(since 1990’s): • Players aimed at earning their profit from price fluctuations without physical deliveries/purchases – working mostly within paper oil market (no major horizontal capital flows to other non-oil financial markets) • Non-oil speculators(since mid-2000’s): • The same – players aimed at pure monetary results, but working within the whole spectrum of global financial markets => enter paper oil market from non-oil & non-commodities paper markets A.Konoplyanik, FINEC, SPB, 13.12.2013
Evolution of oil futures markets • For 2 decades (mid-80-ies/mid-00-ies) oil futures markets were playground for physical market players: • Energy companies, major users of petroleum products (airline & maritime transport, utilities) • They wanted to hedge price risk in their own business (physical deliveries/purchases) • Since mid-00-ies these markets started to attract growing number of financial market traders: • Banks, investment/hedge/pension funds, • They are completely foreign to physical oil market A.Konoplyanik, FINEC, SPB, 13.12.2013
Correlation of scales of oil, commodities and financial & monetary markets(order of figures) Financial & monetary markets = 100+ Prior to 2008 = 1%,2008 = 2% (R.Jones, IEA, at Global Commodities Forum, UNCTAD, Geneva, 31.01.2011) Commodities market = 10+ R.Jones: 500-1000(31.01.2011) “Paper” oil market = 3+ I.Kopytin: 10+ (IMEMO RAS, 22.06.2011) “Physical” oil market = 1 A.Konoplyanik, FINEC, SPB, 13.12.2013
Role of non-oil speculators (global “financial investors”) in forming “price bubble” at the global oil market in 2007-2008 (principal scheme) Inflow of liquidity to the oil market – searching for incremental rate of return Outflow of liquidity from the oil market as result of the starting crisis of liquidity and world financial crisis Non-oil speculators (financial investors from other than oil segments of the global financial market) Value of oil trade operations Oil speculators Oil producers/consumers/traders t A.Konoplyanik, FINEC, SPB, 13.12.2013
Table of contents • Energy markets: general trends & evolution curves, contractual structures & pricing mechanisms (author’s economic interpretation of Hubbert’s curves) • International oil: five stages of global oil market development since 1928 • 2000-ies: new stage in oilpricing • Role of some market players (Saudi Arabia, USA, Russia) A.Konoplyanik, FINEC, SPB, 13.12.2013
Damages and repairs of global oil futures/commodities markets: US role • US past damaging role: • Abolition of Glass-Stegal Law (1999) • Commodities Futures Modernization Act (CFMA) (Dec. 2000) • CFMA left commodity transactions largely outside the reach of CFTC => left companies with minimal regulatory obligations from too risky operations • US expected future repairing role: • Wall Street Transparency and Accountability Act (Dodd-Frank Act) (enacted by US Congress on July 21, 2010; to come into effect on July 14, 2011 =>?) • Dodd-Frank effectively replaces CFMA & makes it illegal for producers to execute trades outside forthcoming & more restrictive CFTC rules A.Konoplyanik, FINEC, SPB, 13.12.2013
Saudi Arabia and USA – two countries really influencing today global oil market • Saudi Arabia(physical oil market): • Level of production + • Level of spare capacities(historically swing producer) + • So-called “fair oil price” (propagated internationally) = de facto fiscal price of Saudi Arabia non-deficit budget • USA(paper oil market): • US role in global economy & global financial markets + • Value of financial (incl. oil) derivatives under US control (4US banks vs 95%) (IMEMO RAS) + • Oil pricing in US dollars(both physical oil & financial oil derivatives) + • USD emission controlled by US FRS+ • Recycling of petrodollars (1970/80-ies: in goods, nowadays – in financial services) • Result: US today as oil importer spend less (at physical oil market) than it earns in oil-related financial transactions (at paper oil market) (IMEMO RAS) A.Konoplyanik, FINEC, SPB, 13.12.2013
USAat global oil market: what happens next? • USA(increasing role at physical oil market): • Decreasing crude import • Increasing exports of petroleum products • From shale gas to shale oil revolution (same technologies within same institutional environment to the market with higher monetization prospects) • US: from gas importer to LNG exporter => further on to oil exporter? • Whether we are moving towards unipolar oil world within double-segment global oil market? A.Konoplyanik, FINEC, SPB, 13.12.2013
USSR/Russia at the global oil market (1) • Yesterday:USSR at the “physical oil” market stages (stages 2-3): • USSR oil production level did not play significant role in defining state of the international oil market => USSR was a «price-taker», not a «price-maker»: • Geography – far away from world consumption centers, • High costs level, • No reserve capacities, but in case of their appearance – no economically justified possibilities to arbitrage them for price-making reasons A.Konoplyanik, FINEC, SPB, 13.12.2013
USSR/Russia at the global oil market (2) • Today: Russiaat the “paper oil” market stages (stages 4-5): • Russian oil production level does not play significant role in defining state of the international oil market => Russia is a «price-taker», not a «price-maker», it is not (and can’t be) an “energy superpower”: • The same factors as in the USSR (worsening geography / geology, high costs, no reserve capacities), plus yet underdevelopment of domestic financial market / system: • Russia de facto not represented at the oil financial derivatives markets (at the level of statistical discrepancy?) => whether it can play noticeable role there if/when domestic financial market underdeveloped ? => matter of time • Yet absence of domestic oil exchange market (local monopolies at physical market + underdeveloped financial market + absence of “quality bank” for oil + …) => matter of time • Sequence of actions: first – financial system,then oil exchange trading (historical experience from global oil market development) • Key: investment climate & cost reduction through value chain A.Konoplyanik, FINEC, SPB, 13.12.2013
Thank you for your attention!www.konoplyanik.ruandrey@konoplyanik.rua.konoplyanik@gazpromexport.com
Oil price balancing Russian budget (with & without “corruption tax”) - & “fair oil price” Electoral years in Russia Buklemishev “Fair oil price” after Egypt & Libya, etc. events (2011): 100-120 USD/bbl Orlova Al-Naimi (2009+) =>SPb Economic Forum (2009): “fair oil price” = 60-80 USD/bbl Oil price, USD/bbl 2000 2005 2010 2013 - Average annual Urals oil price (according to Russian Ministry for Economic De3velopment) - Arithmetic mean price of Buklemishev & Orlova less “corruption tax” Source: Konoplyanik 2011a (figure created by the author based on the data from presentations of Buklemishev O.V. & Orlova N.V. at the conference “20 years after USSR. What’s next?” (Moscow, 09.06.2011) who have kindly provided their data to the author) A.Konoplyanik, FINEC, SPB, 13.12.2013