Software Engineering
Software Engineering. Dr. Thomas E. Potok Adjunct Professor UT Research Staff Member ORNL. Agenda. Homework Review Petri Nets Project Control Example Second Project. Petri Net Overview. Petri nets were invented by Carl Petri in 1966 to explore cause and effect relationships

Software Engineering
E N D
Presentation Transcript
Software Engineering Dr. Thomas E. Potok Adjunct Professor UT Research Staff Member ORNL T. E. Potok - University of Tennessee
Agenda • Homework Review • Petri Nets • Project Control • Example • Second Project T. E. Potok - University of Tennessee
Petri Net Overview • Petri nets were invented by Carl Petri in 1966 to explore cause and effect relationships • Expanded to include deterministic time • Then stochastic time • Then logic T. E. Potok - University of Tennessee
Definition • A Petri Nets (PN) comprises places, transitions, and arcs • Places are system states • Transitions describe events that may modify the system state • Arcs specify the relationship between places • Tokens reside in places, and are used to specify the state of a PN T. E. Potok - University of Tennessee
Switch Example Transition: SWITCH OFF Place: OFF Place: ON Transition: SWITCH ON T. E. Potok - University of Tennessee
Switch Example • Two places: Off and On • Two transitions: Switch Off and Switch On • Four arcs • The off condition is true • A transition can fire if an input token exists • One token is moved from the input place to the output place. T. E. Potok - University of Tennessee
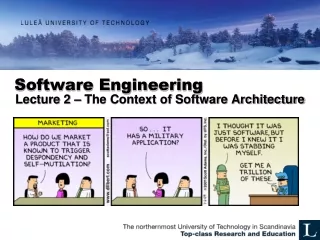
So what’s the big deal? • PERT networks, Activity Nets, Directed Graphs, can represent: • Nodes and arcs • Stochastic timings • But cannot represent states. T. E. Potok - University of Tennessee
PN Properties • 8-tuple mathematical model • M={P,T,I,O,H,PAR,PRED,MP} • P - the set of places • T - the set of transitions • I,O,H - Input, output, inhibition function • PAR - the set of parameters • PRED - Predicates restricting parameter range • PM - Parameter value • From this linear algebra can be used to analyze a network T. E. Potok - University of Tennessee
Manufacturing Example Cards K Idle Input Queue Output Queue Busy Enter Enter In Out T. E. Potok - University of Tennessee
Manufacturing Example Cards K-1 Idle Input Queue Output Queue Busy Enter Enter In Out T. E. Potok - University of Tennessee
Manufacturing Example Cards K-2 Idle Input Queue Output Queue Busy Enter Enter In Out T. E. Potok - University of Tennessee
Manufacturing Example Cards K-2 Idle Input Queue Output Queue Busy Enter Enter In Out T. E. Potok - University of Tennessee
Manufacturing Example Cards K-1 Idle Input Queue Output Queue Busy Enter Enter In Out T. E. Potok - University of Tennessee
Manufacturing Example Cards K-1 Idle Input Queue Output Queue Busy Enter Enter In Out T. E. Potok - University of Tennessee
Manufacturing Example Cards K Idle Input Queue Output Queue Busy Enter Enter In Out T. E. Potok - University of Tennessee
Petri Net Summary • Very rich modeling • Easily capable of modeling software project, requirements, architectures, and processes • Drawbacks • Complex rules • Analysis quite complex T. E. Potok - University of Tennessee
Life-cycle and Project Tracking • A development life-cycle is controlled by the project schedule • Typically done in project meetings • A matter of style how strictly or loosely deadlines are enforced • Typically used as a means of reporting status of the project T. E. Potok - University of Tennessee
Project Control Methods • Schedule • Ensure that the project is meeting the major and minor milestones • Ensure that the necessary inputs are on schedule, or contingency plans are in place • Calculate percent completion metrics T. E. Potok - University of Tennessee
Project Control Methods • Cost • Track spending Vs. available funds • Relate to schedule completion • If you have spent 3/4 or the money, yet have only completed 1/3 or the project, you are in trouble • Information • Track the output coming from each phase of the project • Focus on demonstrations of the projects T. E. Potok - University of Tennessee
Actual Example • Commercially available product • Second generation object-oriented port between platforms. • In this diagram, edges represent activities, and have durations associated with them, while nodes are milestones. • The final product has approximately 64 thousand lines of C++ code, the port required over 8 person-years of effort, and took 16 months to complete. • A Booch type object-oriented methodology was used. T. E. Potok - University of Tennessee
PERT Diagram T. E. Potok - University of Tennessee
Description of Nodes T. E. Potok - University of Tennessee
Life-Cycle Model • There are five (unfolded) iteration cycles. • The first iteration ends with milestones 7 and 8, • The second with 13 and 14, • The third with 19 and 20, • The fourth one with 25 and 26, and • The final iteration with node 30. • The system testing activities run in parallel but are mainly aimed at the software emerging out of the final cycle. T. E. Potok - University of Tennessee
Measure of Schedule Compliance T. E. Potok - University of Tennessee
Completion Profile of First Project T. E. Potok - University of Tennessee
Completion Profile of Second Project (Shown in PERT) T. E. Potok - University of Tennessee
Completion Profile of Third Project T. E. Potok - University of Tennessee
Observations • In all three projects the most frequent value for the task completion delay was zero. About 35%-60% of the tasks finished on the date originally planned. • It is uncommon to finish a task early. Only one project showed a task completing early. • In all three cases, a small group of intermediate or low priority tasks was significantly late, from 7 to 23 weeks after the original deadline. T. E. Potok - University of Tennessee
Next Step • No obvious explanation as to why this result has occurred. • Actual project duration appears to be controlled by enforcement of the key milestones. • Reviewing these results in light of the business model described only plausible explanation for the contradiction observed. T. E. Potok - University of Tennessee
Business Model • The business model provides strong discouragement to finishing key milestones late. • Yet does not provide strong incentives for early completion of intermediate milestone tasks. • Releases typically produce small amounts of code, while versions can be quite large. • The size of the programming team is relatively constant. T. E. Potok - University of Tennessee
Theory • Business Model Drives Productivity • Key deadlines are strictly enforced, which leads to releases being comparatively overstaffed, with ample development time, and little incentive to complete early, • Versions are comparatively understaffed, with short development time, and strong incentive to finish on-time. T. E. Potok - University of Tennessee
Productivity Drivers • Parkinson’s Law - Cyril Parkinson, 1957, the most remembered phase is that “work expands to fill the time ” • Gutierrez et al. have developed a stochastic model to represent the effects of Parkinson’s Law on a project • Unconstrained activity modeling (such as that seen in PERT models) may be inappropriate to represent real projects, • Completion time should be a function of the time scheduled for a project. • Scheduled time may be more a determinant of task completion time than estimated duration time!! T. E. Potok - University of Tennessee
Productivity Drivers • Deadline Effect - Boehm defines the Deadline Effect as “the amount of energy and effort to an activity is strongly accelerated as one approaches the deadline for completing the activity” • Goal theory supports both the Parkinson’s Law, performance is lower if goals are easy, and the Deadline Effect, performance is higher if the deadline is challenging. • The Deadline Effect depends on enforcement of milestone (task/iteration) deadlines. T. E. Potok - University of Tennessee
Model T. E. Potok - University of Tennessee
Simulation Flow T. E. Potok - University of Tennessee
Validation T. E. Potok - University of Tennessee
Conclusion • Project schedules and how they are enforced appear to determine the duration of a task more than: • Task history • Task estimates • Derived distribution maps to reality, with understandable parameters. T. E. Potok - University of Tennessee