Download
1 / 30
300 likes | 324 Vues
This system enables schools to identify and certify students for free meals, generate valuable reports for PED and districts, and minimize administrative burdens. It streamlines data reporting processes and ensures accurate reporting for USDA compliance.

E N D
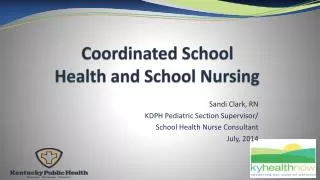
Coordinated School Health and Wellness Bureau (Nutrition) By: Felix Griego Data Coordinator Lisa Hamilton Data Quality Manager
Overview • Direct Certification Match System • STARS Nutrition Data Elements • 742 Verification Report Data Elements • Community Eligibility Provision
Direct Certification (DC)Match System • SharePoint System established for Nutrition to find students that participate in the National School Lunch Program as “Identified Students” which are certified by the School/District for free lunch and breakfasts.
Reports Generated By DC System • NSLP program- district, school, and student reports used to certify students for free meals. • STARS Coordinators- District, School, and Student level reports used to enter data for free and reduced students and Economically Disadvantage Student data. • Title 1- Summary reports with school level reports that can be used to Rank Schools. • K-3 Plus- Reports used to identify eligible schools for Program. All reports are found in specific designated areas Identified by specific Program in STARS.
Entities Impacted By DC Matched System Public Education Department • Coordinated School Health Wellness Bureau • Title 1 • K-3 Plus Program • STARS Reporting District/Schools • Food Service Directors • Title 1 Directors • STARS Coordinators • Administrators STUDENTS
Outcomes of DC Matched System Pros • Provide accurate student data for PED and School/Districts (91.27% accuracy) • New optional student data request in student template (alternate id, family identifier, and a second guardian name) will help increase DC Matched system percentage. • Certify more students for free meals for without application the process. • Provide Baseline Poverty Data • Generate Valuable Reports for PED and Districts. • Minimize Administrative Burdens and Costs Cons • New • Training
STARS Coordinators Reporting Elements for NSLP Free and Reduced Category: • STARS Coordinators are required to flag all students that participate in the NSLP of their free, reduced, or paid status. Data input location- Field 33 in the student template. • Provision 2 and Community Eligibility Schools- all students participate100% free, therefore you report all students free for that school. • Standard Schools- Report students free, reduced, and paid based on income eligibility on the application or direct certification.
STARS Coordinators Reporting Elements for NSLP Continued…… Economically Disadvantage Field: STARS Coordinator required to flag students based on their “Identified student Category” from the DC System in the student template field 88. Flag students with (1, 2, 3, or null value) 1= Students on DC list that show “Y” Yes for SNAP/TANIF 2=Students on DC list showing “Y” Yes for all other categories (Homeless, Migrant, Headstart, Foster, FDPIR) 3= Extended Eligibility Blank (null)= Students that are not ‘identified Categories”
DC Report Established For STARS Coordinators to input the data required by NSLP. • Can be found in STARS under the “Nutrition tab” Screenshot below shows the location and name of the reports established for your use.
FNS 742 Verification Report What is the FNS 742 Report? • Annual Verification Report that is required by USDA to be filled out by all School Food Authorities with important NSLP data elements • Shows how districts are operating NSLP within its district and verifying their applications for their students • July-October Snapshot of current school year • Submitted by PED CSHWB to USDA on March 15 of that current school year.
Correlation of STARS Data to the FNS 742 Free and Reduced Field Economically Disadvantage Field Data reported in this field should be very similar to what district Reports out in section 3-2 and 3-3 in the FNS 742 Verification Report. District is the entity that certifies students as the 1,2,3, or Null value for both reporting elements. DC Matched reports are made for STARS Coordinators entry. • This data can be utilized by NSLP Food Service Directors. • Can be a good edit check to fill out Sections 4 and 5 of the FNS 742 Verification Report for Standard and Provision 2 Base year Schools. • Most of the time this data is entered in by Food Service Directors or Staff in the districts student information system based off the applications received that school year.
Importance of Data Reporting It is important that the data is reported accurately in STARS because it does effect PED DC Matched accuracy percentage (91.27%) reported to USDA USDA NSLP Regulations Benchmarks: The State performance benchmarks for directly certifying for free school meals those children who are members of households receiving benefits under SNAP are 95% for SY 2013–2014 and for each school year thereafter. CIPs required. A State agency that fails to meet the benchmark must develop and submit a CIP to FNS for approval.
Community Eligibility Provision (CEP) History • Healthy, Hunger-Free Kids Act of 2010 • Provides an alternative to household applications for free and reduced price meals • Offers all students free meals in high poverty LEAs and schools • CEP schools do not take applications, but use existing data to provide free meals to all students • Intended to improve access to free meals in high poverty areas while reducing administrative burdens
Who can Elect CEP? • SFAs may elect CEP for all sites, individual schools, or a group of schools. • To be eligible, the LEA, individual school, or group of schools must have an identified student percentage of at least 40%. • “Identified students” are those certified for free meals through direct certification
Eligibility Criteria • Have a minimum percentage (≥ 40%) of identified students in the school year prior to implementing CEP • Serve free lunches AND breakfasts to all students for 4 years • Count total breakfasts and total lunches served to students daily • CEP schools will not conduct verification of applications
Requirements to Participate in CEP • Eligible school or group of schools must have an identified student percentage of at least 40% (reflective of April 1st) of the school year prior to implementing CEP. • LEAs can submit applications by August 31 to begin CEP in SY 15-16. • Participation is an LEA level decision but requires concurrence from the State agency.
Who Are Identified Students? Children certified for free meals without submitting a school meal application Includes children who are directly certified (through data matching or letter-method) for free meals because they live in households that participate in the • Supplemental Nutrition Assistance Program (SNAP) • Temporary Assistance for Needy Families Cash Assistance (TANF) • Food Distribution Program on Indian Reservations (FDPIR) • Applications with case-numbers are categorically eligible for free-meals, but they are not included in the “identified student” percentage
Identified Students Continued….. Includes children who are certified for free meals without application because they are: • Foster care- Need State Agency documentation to count. • Head Start • Homeless- Classified homeless by district liaison • Migrant-Certificate of Eligibility PED Migrant Education Coordinator : Louie Torrez phone: (505) 827-1864 email: louie.torrez@state.nm.us
Calculating the Identified Student Percentage Identified Student % = # of Identified Students X 100 • Total # of enrolled students with access to NSLP/SBP • The identified student percentage may be determined by: • an individual participating school • a group of participating schools in the LEA • entire LEA if all schools participate
Identified student percentage multiplied by a factor of 1.6 equals the % of total meals served and reimbursed at the Federal free rate The remaining % of total meals is reimbursed at the Federal paid rate Any meal costs in excess of the total Federal reimbursement must be covered through non-Federal sources Claiming Percentages
Meal Reimbursements with CEP • The reimbursement rate for both lunch and breakfast is determined by multiplying the percent of Identified Students by a 1.6 multiplier. The resulting number is the percent of meals reimbursed at the “free” reimbursement rate, with the rest reimbursed at the “paid” rate. X 1.6multiplier =
Claiming Percentage Example Valley School District: Total enrollment as of April 1, 2014 = 1352 Identified students = 733 Identified Student percentage = (733/1352)*100 = 54.2% Free Reimbursement Rate = 54.2% * 1.6 = 86.72% Paid Reimbursement Rate = 100 – 86.72 = 13.28% Lobitos SFA’s November 2014 claim = 22,984 total mealsFree meals = 22,984 * 86.72% = 19,932Paid meals = 22,984 * 13.28% = 3,052Edit Check: 19,932 + 3,052 = 22,984
New Mexico Approval and Election of Community Eligibility Provision SY 14-15 Participation for SY 14-15: • 39 Groups • 21 Single Schools • 18 SFA’s with all schools participating • 54 total SFA’s chose CEP option • 345 total schools participating *Districts have until August 31, 2015 to determine if they will want to go CEP for SY15-16
All school districts that implemented the option the first year were surveyed by Food Research and Action Center they found the schools would recommend CEP to high poverty schools like their own School districts report positive feedback from parents and school staff Increased ability to feed more students Some districts report an increase in revenue ($$$$) Feedback from Schools/Districts that Implemented CEP
Title 1 Poverty Data • NSLP data is sometimes used by schools for State funding purposes or Title I • For Title 1 guidance refer to your Title 1 director or the State Title 1 office. • Please see FNS memo SP 19-2014os for specific details.
Contact Information • Felix Griego Data Coordinator • Phone- (505) 827-1470 • Email- felix.griego@state.nm.us Have a great day!