Syngenta tomato UHD Map
80 likes | 404 Vues
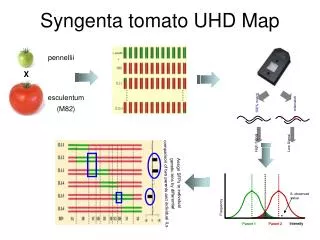
100% match. mismatch. Low Signal. High Signal. IL observed value. Frequency. Intensity. Parent 1. Parent 2. Syngenta tomato UHD Map. pennellii. X. esculentum (M82). Assign SFPs to individual genetic bins by differential comparison of two parents and individual ILs.

Syngenta tomato UHD Map
E N D
Presentation Transcript
100% match mismatch Low Signal High Signal IL observed value Frequency Intensity Parent 1 Parent 2 Syngenta tomato UHD Map pennellii X esculentum (M82) Assign SFPs to individual genetic bins by differential comparison of two parents and individual ILs
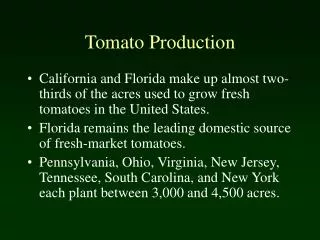
Syngenta tomato UHD Map • ~ 2,000 genetic markers mapped to single a bin • ~6,000 genes mapped to a single bin
Syngenta Tomato Physical Map Coverage 1 2 3 4 5 6 7 8 9 10 11 12 = FPC Coverage
The Data • FPC Contig Number – From AGI Build • Zamir Introgression Line bin position • Chromosome • cM location (if possible) on EXPEN 2000 genetic map • All BACs in anchored FPC contig
Some Physical Map Stats • Number of clones in contigs: 64,918 • Number of contigs:6,794 • Number of anchored contigs: 763 • Number of clones in anchored contigs: 14,256 • Average insert size: 117KB • Genome size: 950MB • Genome coverage of clones in contigs: 8X • Megabases of tomato genome in anchored contigs: 208 = 26%
We can do more…. • Manual gap filling • Add our internal SSRs to and anchor more BAC contigs. • Hybridize arrayed BAC filters with our markers?
Questions we don’t know the answers to: • How are BACs chosen for sequencing? • BACs that are directly linked to markers (hybridization, BAC ends) • Are minimum tilling paths chosen from fingerprint overlaps? • How are neighboring FPC contigs chosen? • Looks like the Sanger Center has fingerprinted a Mbo1 BAC library and and done an FPC build with clones from both libraries. • Are other sequncing groups using this build or the AGI build? • Were the Mbo1 clones hybridized to markers? • Was BAC end sequencindone on the Mbo1 library?