Stroke Improvement National Audit Programme
Discover the outcomes of stroke care across various UK regions in our interactive slideshow. By clicking on your specific region on the map, you can access detailed results from the National Audit Programme for patients admitted from October to December 2011. Each region, including North East, North West, Yorkshire and the Humber, and London, provides insights into the quality of stroke care, including immediate access to life-saving treatments and the structure of integrated stroke services. Get involved and learn how your area performs in stroke care improvement.

Stroke Improvement National Audit Programme
E N D
Presentation Transcript
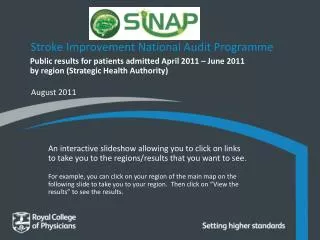
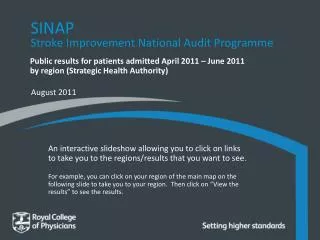
Stroke Improvement National Audit Programme An interactive slideshow allowing you to click on links to take you to the regions/results that you want to see. For example, you can click on your region of the main map on the following slide to take you to your region. Then click on “View the results” to see the results. Public results for patients admitted October 2011 – December 2011 by region
Click on the relevant number on the map or below to go to your region’s results 1North East 2North West 3Yorkshire and the Humber 4West Midlands 5East Midlands 6East of England 7South West 8South Central 9London 10South East Coast 1 3 2 5 4 6 8 9 7 10 Feedback
Back to map North East View the results NB the results for the North East are spread across 2 pages.
Back to North East map Back to England map North East (results part 1 of 2)
Back to North East map Back to map North East (results part 2 of 2)
Back to map View the results North West NB the results for the North West are spread across 4 pages. The Greater Manchester & Cheshire Cardiac and Stroke Network has an Integrated Stroke Service that is described as follows: The patient who presents within 4 hours of the onset of stroke will be sent to (depending on the time of day and geography) either the Comprehensive Stroke Centre or one of the two Primary Stroke Centres These centres are able to deliver thrombolysis treatment and have rapid access to CT perfusion scan, CT angiography, MR and MRA scanning with immediate reporting. Pathways at these centres are in place for immediate access from A&E (to stroke unit bed) with access to cardiac monitoring, ICU access and specialist nursing. This means that patients sometimes go to a comprehensive/primary stroke centre before being ‘repatriated’ to a district stroke centre - normally their local hospital. Patient records in SINAP are assigned to the first hospital to see the patient (comprehensive/primary stroke centre).
Back to North West map Back to map North West (results part 1 of 4)
Back to North West map Back to map North West (results part 2 of 4)
Back to North West map Back to map North West (results part 3 of 4)
Back to North West map Back to map North West (results part 4 of 4)
Back to map Yorkshire and the Humber View the results NB the results for Yorkshire and the Humber are spread across 4 pages.
Back to Yorkshire map Back to map Yorkshire and the Humber (results part 1 of 4)
Back to Yorkshire map Back to map Yorkshire and the Humber (results part 2 of 4)
Back to Yorkshire map Back to map Yorkshire and the Humber (results part 3 of 4)
Back to Yorkshire map Back to map Yorkshire and the Humber (results part 4 of 4)
Back to map West Midlands View the results NB the results for the West Midlands are spread across 4 pages.
Back to West Midlands map Back to map West Midlands (results part 1 of 4)
Back to West Midlands map Back to map West Midlands (results part 2 of 4)
Back to West Midlands map Back to map West Midlands (results part 3 of 4)
Back to West Midlands map Back to map West Midlands (results part 4 of 4)
Back to map East Midlands View the results NB the results for the East Midlands are spread across 2 pages.
Back to East Midlands map Back to map East Midlands (results part 1 of 2)
Back to East Midlands map Back to map East Midlands (results part 2 of 2)
Back to map East of England View the results NB the results for the East of England are spread across 4 pages.
Back to East of England map Back to map East of England (results part 1 of 4)
Back to East of England map Back to map East of England (results part 2 of 4)
Back to East of England map Back to map East of England (results part 3 of 4)
Back to East of England map Back to map East of England (results part 4 of 4)
Back to map South West View the results NB the results for the South West are spread across 4 pages.
Back to South West map Back to map South West (results part 1 of 4)
Back to South West map Back to map South West (results part 2 of 4)
Back to South West map Back to map South West (results part 3 of 4)
Back to South West map Back to map South West (results part 4 of 4)
Back to map South Central View the results NB the results for South Central are spread across 2 pages.
Back to South Central map Back to map South Central (results part 1 of 2)
Back to South Central map Back to map South Central (results part 2 of 2)
Back to map London View the results NB the results for London are spread across 2 pages. In London, there is a regional organisation of stroke care. For the period this report relates to, there were 9 hospitals operating as HASUs (Hyperacute Stroke Units). The majority of stroke patients are directly admitted to these hospitals. There are also SUs (Stroke Units), but they do not directly admit a sufficient number of patients to be included in this report.
Back to London map Back to map London (results part 1 of 2)
Back to London map Back to map London (results part 2 of 2)
Back to map South East Coast View the results NB the results for the South East Coast are spread across 4 pages.
Back to South East map Back to map South East Coast (results part 1 of 4)
Back to South East map Back to map South East Coast (results part 2 of 4)
Back to South East map Back to map South East Coast (results part 3 of 4)
Back to South East map Back to map South East Coast (results part 4 of 4)
Back to map Feedback • We are keen to have feedback on this presentation, and particularly if you have used it for quality improvement purposes. • Please send feedback to: sinap@rcplondon.ac.uk • For more information, please visit: • www.rcplondon.ac.uk/sinap