Download
1 / 35
350 likes | 458 Vues
Scenario for Free Trade in APEC -From the viewpoint of Japan & NAFTA- Theo Jonker & Minoru Ono Aug. 1, 1998. Goal in APEC. In 1994, APEC members agreed Free Trade by 2010 for industrialized countries by 2020 for developing countries. Problem.

E N D
Scenario for Free Trade in APEC -From the viewpoint of Japan & NAFTA- Theo Jonker & Minoru Ono Aug. 1, 1998
Goal in APEC • In 1994, APEC members agreed Free Trade by 2010 for industrialized countries by 2020 for developing countries
Problem • In Chapter 9 of GTAP BOOK…….. Free Trade in all sectors • But……… Tough trade negotiation in food sector Easier in manufacturing sector
Possible scenarios Step 1 Free Trade only in Manufacturing Sector in APEC Step2 Free Trade in Manufacturing Sector in APEC & Free Trade in Food Sector in only ASEAN Step3 Free Trade in Food & Manufacturing Sector in APEC
Closure & Solution Method, etc. • Closure - Standard Multi-regional GE closure (MRGE) • Solution Method - Gragg 2-4-6 • Aggregation - 10 Regions x 3 Sectors 1 NAFTA 2 Japan 1 Food 3 Australia-New Zealand 2 Manufacturing 4 China-Hong Kong 3 Services 5 South Korea 6 Taiwan 7 Malaysia-Singapore 8 Thailand-Philippines 9 Indonesia 10 Rest of the World
Composition of Japanese private households’ consumption Food Manufacturing APEC FTA $316 bln. APEC FTA $294 bln. Base data $334 bln. Base data $278 bln.
Conclusions • APEC Free Trade Area for manufacturing products has positive effect to Japan and NAFTA. However, the impact is small. • APEC Free Trade Area for manufacturing products has a negative effect to ROW. • ASEAN Free Trade Area for food products has hardly any effect to Japan and NAFTA. • APEC Free Trade Area has a big impact on the Japanese economy in the GTAP model, but - politically - there is a very strong opposition to a tariff reduction in the food sector.
GTAP Short Course 1998 Free Trade in the Pacific Rim Chapter 9 Extensions
Overview of the Talk ???? With special help from: The Origins The Extensions: Old versus new Closing Rule Impact of APEC food tariff elimination on Japan Christian and Rob PE versus GE Melting down Asia
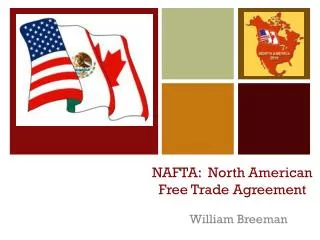
Model structure and model Oooppss!!! GTAP GAMS/MPSGE Countries: APEC (all Asean Countries, Australia, NZ, NAFTA, Chile) and ROW Sectors: Food, Manuf. and services • 3 Scenarios • APEC Preferential Free Trade Area • APEC Trade Reform on a MFN basis, ROW does not reciprocates • APEC Trade Reform on an MFN basis, ROW reciprocates
Results • Overall welfare effects as expected: MFN-Re>MFN>PR • Liwayway and Michael, “Playing Games with GTAP”, paper to published at the coming conference in Denmark (please do not quote) • No incentive for ROW to reciprocate: MFN better • MFN: but NAM and ANZ are the big loosers • PR will be the solution • Once again Nam is a big looser • No Trade Reform!
Tracing Back Japan’s CGDS Utility Increase in GTAP Variable Change Remark • CGDS $US34,155 Mil Increase in Utility from sale of capital goods • pcgds 5.4%Increase in price of capital sold • pgdp 4.86%Increase in general price level • qxs 25.65%Increase total exports - especially e.g. nam - 70% exports of manufacuters where row - 37% Japan accounts for 14% of world exports of manufactures • tms fall due to liberalization drop in import tariffs on Japanese e.g. nam - 17.5% goods row - 14%
Closure Rules SAVE(“JAP”) SAVE(“ROW”) psave(“ROW”) psave(“JAP”) Global Bank pcgdswld pcgds(“JAP”) pcgds(“ROW”) CGDS(“JAP”) CGDS(“ROW”)
Old versus new closure Old closure Change in pcgds: ~ +5% Change in Psave: 0% New closure Change in pcgds: ~ +5% Change in Psave: ~ +5%
Impact of Asian Financial Crisis Sumio Ishikawa and Jianbang Gan
MOTIVATION • To estimate the potential impact of increased risks in the Asian financial market; and • To analyze the role of the regional free trade agreement in the economic recovery in Asia.
METHODOLOGY Modeling country risk and capital flows in GTAP (Gerard Malcolm, 1998): RORE(r)/RSK(r) = RORG rore(r) = rorg + risk(r) rore(r) = rorg + cgdslack(r), when RORDELTA = 1
SCENARIOS • Risk • Risk + Free Trade Agreement (FTA) • Risk + Capital Outflow
Impact on Structural Change due to Risk (% change in output)
Impact on Structural Change due to Risk & FTA (% change in output)
Impact on Structural Change due to Risk & Capital (% change in output)
CONCLUSIONS • Asian financial crisis has global impacts. • Regional trade liberalization will help economic recovery in Asia. • Additional capital outflows will intensify the impact of financial market risks.