Download
1 / 35
370 likes | 575 Vues
Trade-offs between Agricultural Production and Ecosystem Services at a Farm Level. by Seth Soman a & Steven Kraft b. a. Dickinson State University b. Southern Illinois University Carbondale. Overview of Presentation Introduction Research Objective Study Area Methodology

E N D
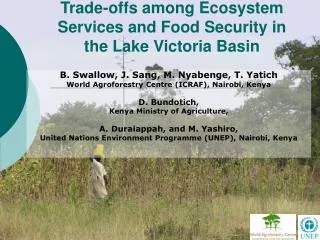
Trade-offs between Agricultural Production and Ecosystem Services at a Farm Level by Seth Somana & Steven Kraftb a. Dickinson State University b. Southern Illinois University Carbondale
Overview of Presentation • Introduction • Research Objective • Study Area • Methodology • Results • Conclusion
Multifunctionality Multifunctionality refers to the possibility that an economic activity may have multiple outputs, both commodity and non-commodity outputs and consequently may contribute to several societal objectives at once. Example in agriculture: positive externality (open space, landscape amenities); negative externality (soil erosion, eutrophication) Agricultural landscapes with riparian buffers have positive multifunctional attributes (Boody et al., 2005, Jordan et al., 2007).
Riparian Buffers provide a variety of ecosystem services • Enhance Water Quality • Provide Terrestrial Habitat • Provide Stream Habitat • Flood Control • Carbon Sequestration
Multiple attributes or joint products of riparian buffers have received considerable attention in the policy realm. Problem : Public goods Agriculture contribute to 50% of the land in the contiguous U.S (Vitousek 1997) most of these lands are privately owned.
Economic or monetary valuation of ecosystem services is difficult due to: • Non availability of a functioning market • Not all services have a market price (e.g. photosynthesis) • Services are interrelated • Time consuming • High Cost
Conservation Policies The U.S. government has made available a number of federal programs to provide markets for these ecosystem services by properly managing the activities within an agricultural watershed. -- Conservation Compliance, Land retirement program, Working land NCBI formed in 1997 is a public and private partnership aimed at helping farmers and landowners install conservation buffer on their lands (USDA-ERS 2000). The Goal of NCBI--- install 2 million miles of buffer on environmentally sensitive lands. By the year 2000 one million miles was installed; 2004 1.55 million miles.
Decision Environment • A large number of factors affect land owners’ willingness to change land use decisions to capture or maintain environmental benefits (Lockeretz, 1990; Napier, 1991; Kraft and Loftus, 2003) • Personal characteristics of the farm owner (age, education) • Institutional connection • Economic factors • Financial incentives • Legal rights
Research Purpose and Questions • Develop a methodology to capture the various ecosystem services provided by riparian buffers and agricultural production on a farm level. 2. How much of these services should be produced in a socially efficient way on a farm level? • How much of commodity and non-commodity outputs that could be produced? 3. Develop a trade off between commodity and non-commodity outputs.
Evaluating the trade-offs among multiple objectives Agricultural income is more important Environmental quality and agricultural income are equally important. Gross Margin Production possibilities curve Environmental quality is more important. Ecosystem Services
Study Area Cache Watershed encompasses, 1,944km2 of southern Illinois near the confluence of the Mississippi and Ohio Rivers. The Watershed has diverse ecological resources and unique natural communities. At least 100 state threatened or endangered plant and animal species are known within the watershed (USFWS 1990). Endangered species: Cypress and Tupelo swamps
The Big Creek is a tributary of the Lower Cache River with a drainage area of 33,088 acres (51.7 square miles). This stream originates in Union County in the Lesser Shawnee Hills PROBLEMS ADDRESSED • Loss and fragmentation of natural habitat • Dramatically altered hydrologic systems • Sediment deposition in the wetlands • Land use and economic activities that are incompatible with the long term maintenance of ecological function
Methodology • Integrated Modeling approach • Modeling based integrative decision making will be the methodology that will be used in this study. • Ecosystem services • -Water quality: reduced sediment, N, and P loads • Wildlife enhancement. • Economic: Gross margin
Modeling Framework GIS Platform Input-output Economic model Water Quality Index Wildlife Index AGNPS Ecosystem services Optimization model IDENTIFY THE TRADE OFF CURVE THAT MAXIMIZES GROSS MARGIN & ESS • Ecosystem Services • Sediment Reduction • Nitrogen Reduction • Phosphorous Reduction • Wildlife Enhancement EA Generates the LU pattern
Evolutionary Algorithms (EAs) • Simplified models of biological evolution, implementing the principles of Darwinian theory of natural selection (“survival of the fittest”) and genetics • Stochastic search and optimization algorithms • Key idea: computer simulated evolution as a problem-solving technique
Landuse and management choices Integer Code Binary Code Landuse & Management Acronym 0 0000 Riparian buffers RIP 1 0001 Alfalfa Hay ALF 2 0010 Corn no-till CNT 3 0011 Corn conservation till Fall CVF 4 0100 Corn conservation till Spring CVS 5 0101 Double crop conventional wheat DVW 6 0110 Conservation Reserve Program (CRP) PCR 7 0111 Soybean no-till SNT 8 1000 Soybean conventional till fall SVF 9 1001 Soybean conventional till spring SVS 10 1010 Double crop no-till soybean DNS 11 1011 Double crop no-till DNT 12 1100 Wheat conventional tillage WNB 13 1101 Wheat no-till WNT 14 1110 Grasslands GLM 15 1111 Riparian buffers RIP Number of landuse and management types: 14 Gene: Binary string of length 4
Multi-objective optimization (MOO): To find a large number of Pareto optimal solutions with respect to multiple objective functions. Maximize subject to Multi-objective Optimization Problem Pareto Optimal Solutions Many Pareto-optimal solutions • Goal of MOO • Find solutions close to Pareto optimum • Find as many diverse solutions as possible Maximize Maximize
Water Quality Hydrological Model • Agricultural Non-Point Source (AGNPS) Pollution Model – USDA lead agency • AGNPS single event, empirical based distributed parameter model • AGNPS operates on a cell basis • AGNPS requires 22 input parameters • To simulate riparian buffer • -- Curve number (mixed deciduous forest); Manning’s n : 0.005; C factor (95% vegetative density & 75% canopy cover); Surface condition factor of 1.0
Economic Model • Farm Economic Model based on Soil specific Crop yields • Market Price • Labor and Machinery Constraints • Production (operating) costs • Wildlife Index model USDA- NRCS Landuse type Tillage type Distance to streams or water body Distance from forested areas
Data • Digitized Fields for the Big creek watershed • Soils- SSURGO • DEM • Price of crops, yields for various crops based on soil types • Cost of Production • Labor and machinery cost on a per farm basis • Nitrogen and Phosphorous application rate
Variable Buffer Width Buffer width = 20ft + (1.5 x (for each 1% increase in slope) 5.7% of the watershed area (1055 acres)
Wildlife Index Distance from stream Distance from forest Crop type Tillage type Width of buffer
Economic Model Cost of production and Market Price Soil Specific Crop yields Field-Farm-Cell lookups --to capture the water quality parameters
Results Integrated Modeling approach Population 100 Generation: 100 Cross over probability: 0.5 Mutation probability : 0.2 ---- time: approximately 16 hrs
I st Gen 25 th Gen 50 th Gen 100 th Gen Results Progression of GA
Results Economic profit and Water quality
76000 A 68000 60000 52000 B Gross Margin ($) 44000 36000 C 28000 20000 20000 25000 30000 35000 40000 Wildlife Index Economic Profit and Wildlife Index
Water quality Vs Gross margin Wildlife index Vs Gross margin Water quality Vs Wildlife index Competitive Complementary Competitive Complementary Competitive Complementary No of Farms 68 23 91 0 58 33 Types of PPF relationships Complementary relation between gross margin and water quality.
VARIABLES Mean df P-value t-value Alfalfa (tons/acre) Complementary 2.8695 Competitive 2.9169 89 .760 -.306 Corn (bu/acre) Complementary 107.5450 Competitive 121.3445 89 .000 -4.244 Soybean (bu/acre) Complementary 32.3470 Competitive 38.7207 89 .000 -6.151 Wheat (bu/acre) Complementary 41.2305 89 3.71 0.899 Competitive 47.5531 89 .000 -5.435 Area (acres) Complementary 97.0597 Competitive 262.7512 89 .000 -6.484 Slope (percent) Complementary 8.5502 Competitive 7.5348 89 .009 2.688 Agent type --Small farms, on highly sloped areas with low crop productivity have a complementary relationship between gross margin and water quality
Summary of Analysis of tradeoffs done for high price scenario • It was costly to provide more ecosystem services as the price of commodity increased. • Most of the profit maximizers and conservationist was closer to the PPF – indication of efficiency. • With high price scenario all the farm had a competitive relationship indicating that with high prices it is economically profitable to have commodity crops.
Landuse Acres Maximizes Gross margin Maximize Water quality Maximize Wildlife Index Corn No-till 1,399.06 0.0 0.0 Corn Conservation Till 2,204.86 0.0 0.0 Soybean No Till 2,695.25 0.0 0.0 Soybean Conservation Till 2,744.51 0.0 0.0 Wheat 5,54.48 0.0 0.0 Double Crop 1,049.00 0.0 0.0 Alfalfa Hay 5,860.10 7,940.74 953.91 CRP 1,473.00 5,114.77 14,189.65 Pasture Grasslands 383.00 4,496.09 2,413 Buffer 77.00 890.00 885.00 Associated Landuse
Conclusion • In this study an integrated modeling approach (IMA) was developed that can be utilized by various decision makers in analyzing or designing policies that involve multifunctional agricultural outputs. • The study demonstrated that the IMA could be effectively used to find patterns of landuse and determine management choices that approximately optimize sets of economic and environmental objectives. • The IMA generates PPF for ecosystem service production and agricultural production at the farm level. • The IMA also shows that the PPF between water quality and gross margin can be complementary
With higher commodity prices more of an incentive is required in the form of governmental payment/incentives and cost share to promote environmental conservation. Limitations • AGNPS as an yearly average even though AGNPS calculate • the water quality for a single event rainfall rather than on an • yearly basis.
Questions Acknowledgements : Kanpur genetic algorithm lab(Debb): NSGA-II source code Contact: Seth Soman email: soman.sethuram@dsu.nodak.edu