Download
1 / 43
450 likes | 813 Vues
Inclusive Growth and Indian Agriculture. DR. ANIL K. WAVARE DEPARTMENT OF ECONOMICS, Rayat Shikshan Sanstha’s CHHatrapati SHIVAJI COLLEGE, SATARA E-mail- anilwavare75@rediffmail.com. Indian Agriculture.

E N D
Inclusive Growth and Indian Agriculture DR. ANIL K. WAVARE DEPARTMENT OF ECONOMICS, Rayat Shikshan Sanstha’s CHHatrapati SHIVAJI COLLEGE, SATARA E-mail- anilwavare75@rediffmail.com
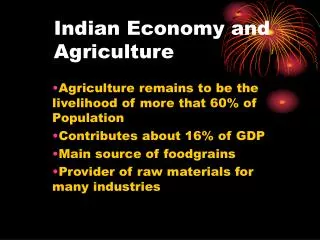
Indian Agriculture • Agriculture Sector is changing the socio-economic environments of the population due to liberalization and globalization • About 71% people are living in rural areas and are still dependent on Agriculture. About 43% of India’s geographical area is used for agricultural activity • Agriculture continues to play a major role in Indian Economy
Indian Agriculture • Total Area of the Country: 3287263 sq. km. • Agriculture: 141.23 M. H. • Area: (43% of total) • Irrigated area: 40% • Rain Irrigated area: 60% • Provides about 56% of the livelihood • Accounts for 15% of GDP • Contributes 21% of Total Exports, and Supplies Raw materials to Industries • Food grains production – 235.88 mt (2010-11 estimate)
India’s position in world Agriculture ParticularsRank • Total Area Seventh • Irrigated Area First • Population Second • Economically Active population Second • Sugar and Sugarcane First • Total Cereals Third • Wheat Second • Rice Second • Coarse grains Fourth • Total Pulses First • Oil Seeds Second • Fruits and Vegetables Second • Implements (Tractors) Third • Milk First • Live Stock (castles, Buffaloes) First
Mile Stones in Agricultural Development • Green Revolution • Post Green Revolution • White Revolution • Blue Revolution (water, fish) • Yellow Revolution (flower, edible) • Bio-Technology Revolution • ICT Revolution
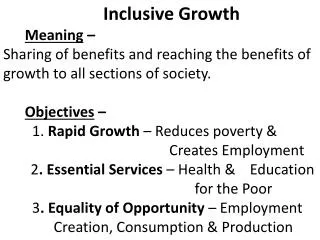
Need for Inclusive Growth • However, exclusion continued in terms of low agriculture growth, low quality employment growth, low human development, rural-urban divides, gender and social inequalities, and regional disparities etc. • There is now recognition that inclusive growth should be achieved in order to reduce poverty and other disparities and raise economic growth. • 11th Plan (2007-12) advocates for inclusive growth. • Even at international level, there is a concern about inequalities and exclusion and now they are also talking about inclusive approach for development. • In this presentation, I will be discussing issues and challenges for achieving inclusive growth.
Elements of Inclusive Growth • Five interrelated elements of inclusive growth. • Agricultural Development • Poverty Reduction and increase in quantity and quality of employment • Social Sector Development • Reduction in regional disparities • Protecting the environment
Problems in Indian agriculture • Long term factors: Steeper decline in per capita land availability. Shrinking of farm size • Slow reduction in share of employment (still 55%) • Main problem is low labour productivity in agriculture. Gap between agri. and non-agri. is widening. • We should blame non-agriculture (industry and services) for not absorbing workers from agriculture.
Three Goals of Agricultural Development • 1.Achieve 4% growth in agriculture and raise incomes. Increasing productivity (land, labor), diversification to high value agri. and rural non-farm by maintaining food security. • 2.Second goal is sharing growth (equity): focus on small and marginal farmers, lagging regions, women etc. On lagging regions, focus on Eastern India and other rainfed areas. • 3. Third is to maintain sustainability of agri. by focusing on environmental concerns.
Deficits in Agriculture Growth • Six deficits in agriculture • :(a) land and water management deficit • (b) investment, credit and Infrastructure deficit, • (c) research and extension (technology) deficit, • (d)market deficit, • (e) institutions deficit, • (f) education/skill deficit
Rural non-farm sector • Poverty can not be removed with 55% of workers in agri. Need to promote rural non-farm sector. • India currently produces about 50 million tonnes of fruits and 90 million tonnes of vegetables. Only 2% of these are processed as against 23% in China, 78% in Phillippines, 83% in Malaysia. • Half of those engaged in agriculture are still illiterate and just 5% have completed higher secondary educ. • Even in 2008-09, around 60% of rural male workers and 85% of rural female workers are either illiterate or educated upto primary level. • In other words, education and skills are constraints
Lessons from China • India leap frogged from agriculture to services with less focus on manufacturing. • The share of employment in manufacturing in Malaysia is 50%, in Korea 62%, in China 31%. On the other hand, the share of employment in manufacturing in India is only 12% • Diversification towards rural non-farm sector in China is one of the important factors responsible for rural poverty reduction (poverty 3%). • This was partly due to high agricultural productivity and investment in physical and human capital.
Development of Indian Agriculture : Basic Issues • Revitalization of Cooperative Institutions • Improving Rural Credits • Research, Education & Extension • Human Resources Development • Trade & Export Promotion • Land Reforms • Enabling Environment for higher Agricultural Growth
The thrust areas • Diversification of Agriculture • Inter-cropping • Water Management • Organic Farming • Agri-Clinics and Agri-business Centres • Bio-Technology
Efforts on Policies, strategies and Frameworks • National Agriculture Policy (2000) • National Seeds policy (2002) • Cooperative Policy • Agricultural Price policy • Agricultural Extension Framework (2001) • WTO/GATT agreement (1994) In addition to, various working groups, taskforces, mid-term appraisalsandplan schemes (~68) (for further details www.agricoop.nic.in)
Technologies for Sustainable Agricultural Development • Biotechnology • Pre & post harvesting technology • Energy saving technology • Environment protection technology • Information and Communication technology • GIS technology • Internet/Intranet Technology
Based on Estimated demand (Million Tonnes) Bhalla et al 257 to 375 IMPACT 237 Kumar and Mittal 269 Radhakrishna and Reddy 253 Bansil 241 Estimated Demand for Cereals in India: 2020
Agricultural Marketing – Constraints • Predominantly marginal or small farmers – Hence small marketable surpluses & limited bargaining power • Poor availability of markets & monopolistic tendencies of APMCs • Inadequate infrastructure in wholesale markets/ rural primary markets • Lack of fairprice discovery mechanism • Multiple and exploitativeintermediaries – low returns • Fragmented supply chain, poor cold chain & high post-harvest losses • Lack of cleaning, grading, packaging & quality certification facilities • Limited access to market information and marketing opportunities available
Amendments Proposed in Model APMC Act • Allow establishment of Private or Cooperative markets/ Farmer-consumer markets/ Direct marketing • Safeguard the interest of the farmers through provisions for Contract Farming • Single point levy & payment of market fee/ Single point registration of functionaries • Prohibition of Commission Agentsfor agriculturists and no deduction to be made towards commission • PPP in management & extension activities/ Promotion of e-trading/ Electronic Spot Exchanges • Encouraging professional management in APMCs • Promotion of Grading & Standardization.
Other Issues Bringing more area under irrigation Better management of water resources including rainwater harvesting and watershed development Better management of land resources by reclaiming degraded land Diversification into animal husbandry and fishery Credit and Insurance Improving markets and incentives Land reforms Agro-processing Lack of Innovativeness Agricultural Research & Extension
Poverty • Income poverty and non-income poverty • We concentrate here on income poverty • The official poverty lines are anchored to a fixed commodity basket corresponding to the poverty line (Rs.49.09 per person per month at 1973-74 prices for rural areas and Rs.56.64 for urban areas). • The suggested rural commodity basket by the Expert Group contained 2400 kcal per capita per day in rural areas and the urban food basket had 2100 kcal per capita per day in 1973-74. • For subsequent years, poverty line is updated with consumer prices.
Poverty • Income poverty declined from 55% in the early 1970s to 28% in 2009-10. • Although there has been progress in decline, still more than 300 million below poverty line. • World Bank Estimates: 42% below $1.25 poverty line. ADB 65% with $1.35 poverty line • 80% of the poor are from rural areas. • Poverty concentrated in few states (Bihar, Uttar Pradesh and Madhya Pradesh and Orissa, Chattisgarh and Jharkhand) • Concentrated among agricultural labourers, casual workers, Scheduled Castes and Scheduled Tribes
Determinants of Rural Poverty • Agricultural Growth • Relative food prices • Rural non-farm sector • Rural wages • Governments’ development expenditure • Infrastructure • Human Development
Policies for Poverty Alleviation • India adopted two pronged approach -- Growth approach: all three sectors contribute agriculture, industry and services -- Direct approach : Safety nets or anti-poverty prog. -- Self employment progra. (women’s groups), wage employment progra, food subsidies, nutrition programmes for children, old age and maternity benefits -- Public Distribution System – Subsidized food -- National Rural Employment Guarantee Scheme (NREGS) – Giving 100 days of wage employment to the poor
Problems in Employment • Share in Ouput and Employment of different sectors • Agriculture: 15% in GDP, 56% in Employ. • Industry: 29% in GDP,19% in Employ. • Services: 56% in GDP, 25% in Employ. • Employment growth increased in recent years but quality is low. • Problem of working poor • Poverty is much higher than unemployment
Problems in Employment • There are 458 million workers in India in 2004-05 • Out of this 423 million workers are informal/unorganised workers (92%). • Growth in employment more in unorganised sector. • Thus, quality of employment is a problem • Workers in this sector do not have social security. • Government is trying to provide minimum social security to unorganized workers
Social Development • In social sector, significant achievements in education and health • However, Human development index rank is 127 out of 170 countries. • Social indicators are much lower for Scheduled castes and Scheduled tribes • Malnutrition among children is one major problem (46% of children's suffer from malnutrition
Six problems in Social Sector: education and health • Low levels of social indicators • Slow progress • Significant regional, social and gender disparities • Low level and slow growth in public expenditures particularly on health • Poor quality delivery systems • Privatization of Health and Education
Regional Disparities • Significant Regional Disparities in India. • Female infant mortality varies from 12 in Kerala to 88 in Madhya Pradesh • Female literacy varies from 33.6% in Bihar to 88% in Kerala
Regional Disparities • Inter-state disparities in the growth of Gross State Domestic Product (GSDP) increased in the post-reform period compared to the eighties. • In general, richer states grew faster than the poorer states. • Causes for disparities; • Investment in physical and human capital • Technology • Institutions including governance
Environment • Degradation of land, water. Increase in pollution levels • Challenges of climate change • Consumption patterns of rich • Higher economic growth should not lead to decline in our environment
What Should be done to improve inclusive growth? • Equity is important for economic development • Agricultural Development • Economic reforms are important. But macro-poor policies (fiscal, trade, financial, monetary etc.) should have pro-poor focus • Structural change should have followed agriculture-industry-services sequence • Development of manufacturing sector is important for creation of productive employment • Equality of opportunities (education) • South East Asian and East Asian experience
What should be done? (contd.) • Role of Technology • Shift focus of reforms to delivery systems • Importance of women’s economic and social empowerment • Decentralization • Economic reforms in relation to socio-political environment • Rights approach (civil, political and economic)
Conclusion • There is a need to have a broad based and inclusive growth to benefit all sections of society and improve economic growth. • We have examined issues and challenges in five elements of inclusive growth (poverty and employment, agriculture, social sector, regional disparities and environment) • It is more challenging for the country to achieve inclusive growth than getting 8 to 10 per cent growth in GDP
Conclusion • There are strong social, economic and political reasons for achieving broader and inclusive growth. • Socially, lack of inclusive growth leads to unrest among many people. • There is also an economic argument. The measures which raise equity also promote economic growth. • Lastly, the political argument is that no government in a democracy can afford to ignore large sections of workers and non-working population. • If it is not inclusive it can generate very severe social tensions. Thus, politically, for having a stable and democratic society one needs to have inclusive growth.