Download
1 / 25
250 likes | 395 Vues
The Modern Age of the Earth . Richard J. Lloyd Nov. 18, 2008 Edinboro University of Pennsylvania. Objectives . History of dating methods, pre-radioactive era The era of radioactive discovery Dating methods and their applicability How to date a rock The Age of the Earth.

E N D
The Modern Age of the Earth Richard J. Lloyd Nov. 18, 2008 Edinboro University of Pennsylvania
Objectives • History of dating methods, pre-radioactive era • The era of radioactive discovery • Dating methods and their applicability • How to date a rock • The Age of the Earth
History of Dating Methods (Western) Biblical Chronologies • Chronologie de l’historiesainte (1738) collected over 200 computations with creation dates ranging from 3483 B.C. to 6984 B.C. • Johannes Keplercombined biblical and astronomical arguments. Result: 3993 B.C. Mostly based on determining the time elapsed between known historical events—i.e. the Flood, Abraham, etc. by summing lists of generations and the reigns of various rulers. Assumed roughly 3 generations per century and about 25 years/ruler typically
History (cont.) Kepler’s Chronology Based on the belief that Earth was created at the summer solstice when the solar apogee was at the head of the constellation Aries. Using the known rate at which the solar apogee moved, a date could be calculated. Ussher’s Chronology Most famous for his prediction of creation in October 22, 4004 B.C. at midnight using astronomical cycles, historical accounts and biblical chronology.
The Modern, Pre-Radioactive Era Credibility of biblical chronologies eroded in 17th and 18th centuries when observations of nature were becoming more precise in concert with the theories that explained natural phenomenon. Methods based on scientific explanation became popular, variously depending on observations of: • Declining sea levels • Cooling of Earth and Sun • Scenarios involving the Moon’s origin • Salt clocks and sedimentation
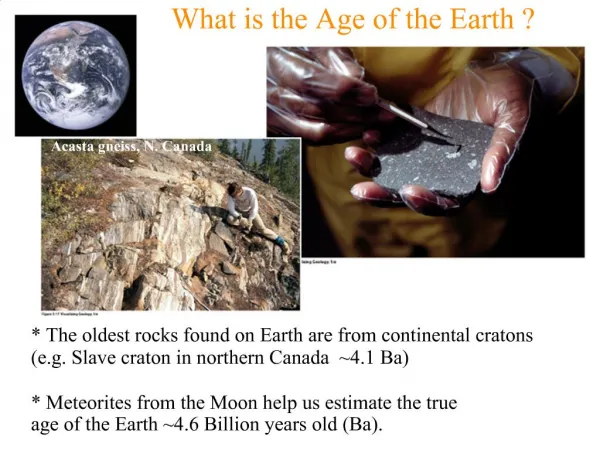
Declining Sea levels De Maillet (1720’s) • Based on assuming Earth was once entirely covered with water This was NOT stupid! Marine strata bearing sea shells were found in inland mountains • Tried to measure present rate of sea level decline from historical records and modern data. Result: 2.4 Gyr—half the modern result! Why It Was Wrong We know (now!) that most sea level declines locally are due to land UPLIFT. There are other places where the land level is falling. These effects are due to geological forces not understood in the day of De Maillet. The modern theories of geology were over a century away, and almost 250 years before plate tectonics.
Cooling of Earth and Sun Comte de Buffon (1749) Why It Was Wrong Measured the rate of cooling of iron spheres of various diameters—found a nearly linear relationship between diameter and cooling time. Extrapolated this to a molten Earth of known diameter—96,700yrs. Buffon himself didn’t trust his results and noted that the thickness of sedimentary rocks would affect cooling rate. In other calculations, he estimated ages up to 3 Gyr.
Cooling, cont. William Thomson, Lord Kelvin (1860) Why It Was Wrong Postulated Sun was receiving energy from infall of meteoric material. Observations showed too little material to maintain the Sun’s temperature—Sun must be cooling. Variously estimated between 10-500 million years for the age of the Sun There was no way to measure the Sun’s temp. at the time (Kelvin put it at 2.3 times the actual value) He assumed the specific heat of the Sun was the same as water He disregarded any possible INTERNAL heat sources.
Cooling, cont. Kelvin, round 2 Wrong, again! Applied similar reasoning to the Earth’s cooling. Used data collected from mines, showing increasing temp. with depth. Using various guesses and supplementary evidence, the result was about 98 Myr. Kelvin used inadequate theory of heat conduction Data available was sparse, unreliable. Dismissed INTERNAL sources of heat, specifically lunar tidal friction, chemical action, etc. Radioactivity was still unknown.
Other Methods Moon’s Origin (1890) Why Wrong Hypothesis was that Moon was formed by rapid rotation of Earth in Early history—mat’l flew off Tidal friction slowed Earth’s rotation at rate which could be measured—resulted in Earth less than 1 Gyr. Moon probably originated from impact of planetoid sized body Hypothesis could not account for inclination of Moons orbit with Earth’s rotation Moon would have been 3 times larger under this hypothesis than it really is.
Salt Clock Various proponents (1900) Why Wrong Assume that the influx from rivers, precipitation of salts and other minerals into the oceans simply accumulates Measures the present rate of influx and assume constant—results in dates of order of 100 Myr. Ocean crustal material is recycled by the oceanic conveyor belt—unknown at time. The ocean “consumes” material influx Rates of mineral influx are poorly known over large periods of time. Not constant at all.
Sedimentation Various (late 1800’s, early 1900’s) Why Wrong Typically assumed constant average rates of erosion and deposition Computed ages based on known thicknesses of, for example, Cambrian strata Yielded ages on order of 100 Myr. Rates of erosion highly variable Thicknesses of Cambrian strata varied widely depending on location
Summary • Most estimates in the pre-radioactive scientific era relied on theoretical models that were incomplete and had too little reliable measurements as inputs. • The consensus ages collected around predictions of a few hundred Myr—over 10 times too small! • What was needed was a “clock” that was unaffected by ordinary physical processes, including geological, solar, mechanical, etc. events that could affect chemical reactions, weather patterns, erosion and sedimentation that could change age estimates dramatically.
The Radioactive Era • Radioactivity was discovered by Henri Becquerel in 1896 in uranium salts. • Radioactivity was thought to be like X-rays, a form of electromagnetic radiation initially. • Further experiments showed it was mostly composed of charged particles—subatomic in nature • Subatomic processes are insulated from all ordinary physical processes, i.e. chemical interactions, including explosions!
Atomic structure Basic picture Relative sizes The nucleus is very small If the nucleus was a pea at the 50 yd. line in a football field, the nearest electron would be in the endzone. Chemical interactions involve only electrons, not the nucleus.
Radioactivity • Over many years, the properties of radioactive elements were catalogued and experiments were able to determine the statistical laws that governed their decay. • It became possible to know how long the sample had been present by looking at how much decay product had accumulated over time. • A CLOCK HAD BEEN FOUND!
Radioactivity Basics Radioactive decays Change in Nucleus Beta minus decay n0 → p+ + e− + νe Alpha decay 238U → 234Th + α Fission Various (A, Z+1) (A–4, Z–2) A=Z+N, mass number N=# neutrons Z=# protons
Mathematics of Radioactive Decay N=# of radioactive atoms left
Half-lives All radioactive elements have average lifetimes, but often we speak of half-lives. A half-life is defined as the amount of time it takes for a radioactive material to decay to ½ of its original amount, i.e. when we have: This implies that the half-life is:
Analyzing the Rubidium-Strontium Clock Rb-87 decays to Sr-87 in a half-life of 48.8 billion years. A long-lived radioactive element is needed to date something that is very old. • Carbon dating is only good for relatively short time periods, about 70,000 yrs. • C-14 has a half-life of about 5700 yrs. • In about 5-10 half-lives, any radioactive element in terrestrial material falls below minimum detectable amounts (MDA)
How We Date Old Stuff What we need to know How We Know It The amount of radioactive material originally present Has the rock been disturbed in any way to add/subtract material since formation? The decay series of the radioactive element Sometimes unknown, but can be deduced assuming that its decay products were not originally present or it can be determined. Re-melting can often be detected via crystallization. Decay series is known from laboratory experiments.
References • “The Age of the Earth,” G. Brent Dalrymple, Stanford University Press; 1 edition (February 1, 1994) • “Introductory Nuclear Physics,” Kenneth S. Krane,Wiley; 1 edition (October 22, 1987) • “Finding Darwin’s God,” Kenneth R. Miller, Harper-Collins; (1999)