Download
1 / 1
10 likes | 128 Vues
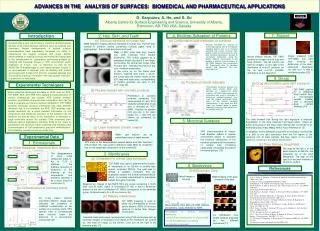
ADVANCES IN THE ANALYSIS OF SURFACES: BIOMEDICAL AND PHARMACEUTICAL APPLICATIONS. D. Karpuzov, A. He, and S. Xu Alberta Centre for Surface Engineering and Science, University of Alberta, Edmonton, AB, T6G 2G6, Canada. O-Ag. O-O. O-O. T=23 o C. T=90 o C. O-O. O-O. O-Ag. T=50 o C.

E N D
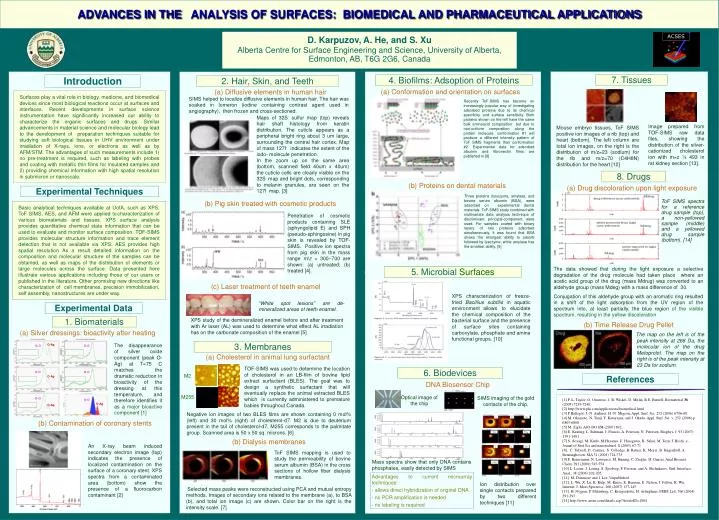
ADVANCES IN THEANALYSIS OF SURFACES: BIOMEDICAL AND PHARMACEUTICAL APPLICATIONS D. Karpuzov, A. He, and S. Xu Alberta Centre for Surface Engineering and Science, University of Alberta, Edmonton, AB, T6G 2G6, Canada O-Ag O-O O-O T=23 oC T=90 oC O-O O-O O-Ag T=50 oC T=110 oC O-O O-O O-Ag T=75 oC O-Ag ACSES D C 7. Tissues 4. Biofilms: Adsoption of Proteins Introduction 2. Hair, Skin, and Teeth F E (a) Conformation and orientation on surfaces (a) Diffusive elements in human hair Surfaces play a vital role in biology, medicine, and biomedical devices since most biological reactions occur at surfaces and interfaces. Recent developments in surface science instrumentation have significantly increased our ability to characterize the organic surfaces and drugs. Similar advancements in material science and molecular biology lead to the development of preparation techniques suitable for studying soft biological tissues in UHV environment under irradiation of X-rays, ions, or electrons as well as by AFM/STM. The advantages of such measurements include 1) no pre-treatment is required, such as labeling with probes and coating with metallic thin films for insulated samples and 2) providing chemical information with high spatial resolution in submicron or nanoscale. SIMS helped to localize diffusive elements in human hair. The hair was soaked in Iomeron (iodine containing contrast agent used in angiography), then frozen and cross-sectioned. Recently ToF-SIMS has become an increasingly popular way of investigating adsorbed proteins due to its chemical specificity and surface sensitivity. Both proteins shown on the left have the same bulk aminoacid composition but due to non-uniform composition along the protein molecule, conformation #1 will produce a different intensity pattern of ToF SIMS fragments than conformation #2. Experimental data for adsorbed albumin and fibronectin films are published in [8] Maps of 32S- sulfur map (top) reveals hair shaft histology from keratin distribution. The cuticle appears as a peripheral bright ring about 3 um large, surrounding the central hair cortex. Map of mass 127I- indicates the extent of the iodo- molecule penetration. In the zoom up on the same area (bottom, scanned field 40um x 40um) the cuticle cells are clearly visible on the 32S- map and bright dots, corresponding to melanin granules, are seen on the 127I- map. [3] Image prepared from TOF-SIMS raw data files, showing the distribution of the silver-cationized cholesterol ion with m=z ¼ 493 in rat kidney section [13]. Mouse embryo tissues, ToF SIMS positive ion images of a rib (top) and heart (bottom). The left column are total ion images, on the right is the distribution of m/z=23 (sodium) for the rib and m/z=70 (C4H8N) distribution for the heart [12] 8. Drugs (b) Proteins on dental materials (a) Drug discoloration upon light exposure Experimental Techniques Three proteins (lysozyme, amylase, and bovine serum albumin (BSA), were adsorbed on experimental dental materials. ToF-SIMS study combined with multivariate data analysis technique of discriminant principal-component were used. For samples coated with binary layers of two proteins adsorbed simultaneously, it was found that BSA shows the strongest ability to adsorb followed by lysozyme, while amylase has the smallest ability. [9] ToF SIMS spectra for a reference drug sample (top), a non-yellowed sample (middle) and a yellowed drug sample (bottom). [14] (c) Fig. 5 (a-c) (b) Pig skin treated with cosmetic products (c) Fig. 5 (a-c) Basic analytical techniques available at UofA, such as XPS, ToF SIMS, AES, and AFM were applied tocharacterization of various biomaterials and tissues. XPS surface analysis provides quantitative chemical state information that can be used to evaluate and monitor surface composition. TOF-SIMS provides molecular structure information and trace element detection that is not available via XPS. AES provides high spatial resolution As a result detailed information on the composition and molecular structure of the samples can be obtained, as well as maps of the distribution of elements or large molecules across the surface. Data presented here illustrate various applications including those of our users or published in the literature. Other promising new directions like characterization of cell membranes, precision immobilization, self assembly, nanostructures are under way. Penetration of cosmetic products containing SLE (sphyngolipid E) and SPH (pseudo-sphingosine) in pig skin is revealed by TOF-SIMS. Positive ion spectra from pig skin in the mass range m/z = 300–700 are shown: (a) untreated; (b) treated [4]. The data showed that during the light exposure a selective degradation of the drug molecule had taken place where an acetic acid group of the drug (mass Mdrug) was converted to an aldehyde group (mass Mdeg) with a mass difference of 30. Conjugation of this aldehyde group with an aromatic ring resulted in a shift of the light adsorption from the UV region of the spectrum into, at least partially, the blue region of the visible spectrum, resulting in the yellow discoloration 5. Microbial Surfaces Optical image SIMS imaging of the gold contacts sample 1 (c) Laser treatment of teeth enamel XPS characterization of freeze-fried Baciliius subtilis in aquatic environmentallows to elucidate the chemical composition of the bacterial surface and the presence of surface sites containing carboxylate, phosphate and amine functional groups. [10] “White spot lesions” are de- mineralized areas of teeth enamel. Experimental Data sample 2 XPS study of the demineralized enamel before and after treatment with Ar laser (AL) was used to determine what effect AL irradiation has on the carbonate composition of the enamel [5] 1. Biomaterials (b) Time Release Drug Pellet Mass spectrum of the contact area (a) Silver dressings: bioactivity after heating The map on the left is of the peak intensity at 268 Da, the molecular ion of the drug Metoprolol. The map on the right is of the peak intensity at 23 Da for sodium. 3. Membranes The disappearance of silver oxide component (peak O-Ag) at T=75 C matches the dramatic reduction in bioactivity of the dressing at this temperature, and therefore identifies it as amajor bioactive component [1] (a) Cholesterol in animal lung surfactant TOF-SIMS was used to determine the location of cholesterol in an LB-film of bovine lipid extract surfactant (BLES).The goal was to design a synthetic surfactant that will eventually replace the animal extracted BLES which is currently administered to premature babies throughout Canada. 6. Biodevices M2 References DNA Biosensor Chip M255 Optical image of the chip [1] P. L. Taylor, O. Omotoso, J. B. Wiskel, D. Mitlin, R.E. Burrell: Biomaterial 36 (2005) 7239-7240. [2] http://www.phi.com/applications/biomedical.html [3] P.Hallegot, J.-N. Audinot, H.-N. Migeon, Appl. Surf. Sci. 252 (2006) 6706-08. [4] M. Okamoto, N. Tanji, Y. Katayama, and J. Okada, Appl. Surf. Sci. v. 252 (2006) p. 6805-6808 [5] M. Ziglo, AJO-DO 131 (2007) 692. [6].E. Keating, L. Rahman, J. Francis, A. Petersen, N. Petersen, Biophys. J. 93 (2007) 1391-1401 [7] S. Aoyagi, M. Kudo, M.Hayama, U. Hasegawa, K. Sakai, M. Tozu, T.Hoshi: e-Jounal of Surf.Sci and nanotechnol. 1 (2003) 67-71 [8]. C. Tidwell, D. Castner, S. Colledge, B. Ratner, K. Meyer, B. Hagenhoff, A. Benninghoven: SIA 31 (2001) 724-733 [9] F. Bernsmann, N. Lawrence, M. Hannig, C. Ziegler, H. Gnaser, Anal Bioanal. Chem. 391 (2008) 545-554 [10] L. Leone, J. Loring, S. Sjoeberg, P. Persson, and A. Shchukarev, Surf. Interface Anal., 38 (2006) 202-205. [11] M. Dinsmore and J. Lee, Unpublished [12]. L. Wu, X. Lu, K. Kulp, M. Knize, E. Berman, E. Nelson, J. Felton, K. Wu, Internat. J. Mass Spectrosc. 260 (2007) 137-145 [13]. H. Nygren, P. Malmberg, C. Kriegeskotte, H. Arlinghaus, FEBS Lett. 566 (2004) 291-293 [14] http://www.azom.com/details.asp?ArticleID=1804 SIMS imaging of the gold contacts of the chip. Negative ion images of two BLES films are shown containing 0 mol% (left) and 30 mol% (right) of cholesterol-d7. M2 is due to deuterium present in the tail of cholesterol-d7, M255 corresponds to the palmitate group. Scanned area is 50 x 50 sq. microns. [6] (b) Contamination of coronary stents (b) Dialysis membranes An X-ray beam induced secondary electron image (top) indicates the presence of localized contamination on the surface of a coronary stent. XPS spectra from a contaminated area (bottom) show the presence of a fluorocarbon contaminant [2] ToF SIMS mapping is used to study the permeability of bovine serum albumin (BSA) in the cross sections of hollow fiber dialysis membranes. Mass spectra show that only DNA contains phosphates, easily detected by SIMS • Advantages to current microarray techniques: • allows direct hybridization of original DNA • - no PCR amplification is needed • - no labeling is required Ion distribution over single contacts prepared by two different techniques [11] Selected mass peaks were reconstructed using PCA and mutual entropy methods. Images of secondary ions related to the membrane (a), to BSA (b), and total ion image (c) are shown. Color bar on the right is the intensity scale. [7]