Download
1 / 13
130 likes | 290 Vues
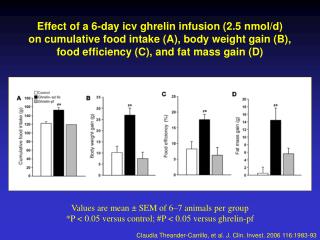
Effect of a 6-day icv ghrelin infusion (2.5 nmol/d) on cumulative food intake (A), body weight gain (B), food efficiency (C), and fat mass gain (D). Values are mean ± SEM of 6–7 animals per group *P < 0.05 versus control; #P < 0.05 versus ghrelin-pf.

E N D
Effect of a 6-day icv ghrelin infusion (2.5 nmol/d) on cumulative food intake (A), body weight gain (B), food efficiency (C), and fat mass gain (D) Values are mean ± SEM of 6–7 animals per group*P < 0.05 versus control; #P < 0.05 versus ghrelin-pf Claudia Theander-Carrillo, et al. J. Clin. Invest. 2006 116:1983-93
Effects of icv ghrelin infusion on total energy expenditure and RQ Claudia Theander-Carrillo, et al. J. Clin. Invest. 2006 116:1983-93
Effects of icv ghrelin infusion on plasma bioactive ghrelin, glucose, insulin, corticosterone, leptin, FFA, and TG levels Claudia Theander-Carrillo, et al. J. Clin. Invest. 2006 116:1983-93
Effect of a 6-day icv ghrelin infusion (2.5 nmol/day) on insulin-stimulated glucose utilization indices measured during euglycemic-hyperinsulinemic clamps in epididymal WAT (A), inguinal WAT (B), BAT (C), and soleus muscle (D) Values are mean ± SEM of 6–7 animals per group *P < 0.05 versus control; #P < 0.05 versus ghrelin-pf Claudia Theander-Carrillo, et al. J. Clin. Invest. 2006 116:1983-93
Effect of a 6-day icv ghrelin infusion (2.5 nmol/d) on epididymal WAT mRNA expression of LPL (A), ACC (B), and CPT-1α (C) Values are mean ± SEM of 6–7 animals per group *P < 0.05 versus control; #P < 0.05 versus ghrelin-pf Claudia Theander-Carrillo, et al. J. Clin. Invest. 2006 116:1983-93
Effect of a 6-day icv ghrelin infusion (2.5 nmol/d) on epididymal WAT mRNA expression of FAS (A) and SCD1 (B), and on epididymal protein expression of WAT FAS (C) and SCD1 (D), with one representative Western blot (of the 2 performed) Values are mean ± SEM of 6–7 animals per group *P < 0.05 versus control; #P < 0.05 versus ghrelin-pf Claudia Theander-Carrillo, et al. J. Clin. Invest. 2006 116:1983-93
Effect of a 6-day icv ghrelin infusion (2.5 nmol/d) on BAT UCP1 (A) and UCP3 (B) Values are mean ± SEM of 6–7 animals per group. *P < 0.05 versus control Claudia Theander-Carrillo, et al. J. Clin. Invest. 2006 116:1983-93
Effects of acute and chronic icv ghrelin infusion on mRNA expression of LPL, ACC, FAS, and SCD1 in epididymal WAT Claudia Theander-Carrillo, et al. J. Clin. Invest. 2006 116:1983-93
Effects of peripheral ghrelin infusion on mRNA expression of ACC, FAS, SCD1, LPL, and CPT-1αin epididymal WAT and UCP1 and UCP3 in BAT Claudia Theander-Carrillo, et al. J. Clin. Invest. 2006 116:1983-93
Effect of a 6-day icv ghrelin infusion (2.5 nmol/d) on hypothalamic NPY mRNA expression Values are mean ± SEM of 6–7 animals per group. *P < 0.05 versus control Claudia Theander-Carrillo, et al. J. Clin. Invest. 2006 116:1983-93
Effect of a 6-day icv ghrelin infusion (2.5 nmol/day) on cumulative food intake (A and B) and body weight gain (C and D) in WT and TKO mice Values are mean ± SEM of 6–7 animals per group. *P < 0.05 versus control Claudia Theander-Carrillo, et al. J. Clin. Invest. 2006 116:1983-93
Epididymal WAT mRNA expression of LPL (A) and SCD1 (B) in WT and ghrelin KO mice Values are mean ± SEM of 5 animals per group. *P < 0.05 versus WT Claudia Theander-Carrillo, et al. J. Clin. Invest. 2006 116:1983-93
Primer sequences used for real-time RT-PCR Claudia Theander-Carrillo, et al. J. Clin. Invest. 2006 116:1983-93