Input-Output Models for Policy Making: Insights and Applications
This paper discusses the application of input-output (IO) models in economic policy making, exploring how these models can be used to analyze industry productivity, national income generation, and the impacts of trade. It highlights key concepts such as the relationship between gross domestic product (GDP) and gross domestic income (GDI), the estimation of input-output coefficients, and the analysis of total factor productivity (TFP). Through examining case studies and methodologies, the paper sheds light on the importance of empirical data in constructing these models for effective policy decisions.

Input-Output Models for Policy Making: Insights and Applications
E N D
Presentation Transcript
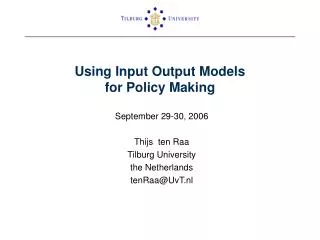
Using Input Output Models for Policy Making September 29-30, 2006 Thijs ten Raa Tilburg University the Netherlands tenRaa@UvT.nl
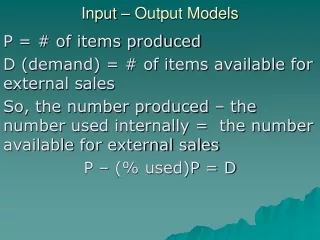
Use and Make Matrices • uij represents the amount of commodity i used by industry j • vij represents the amount of commodity i made by industry j • vij - uij is the net output of commodity i produced by industry j • Summing over industries: Gross Domestic Product (GDP) • Summing over commodities: Gross Domestic Income (GDI) Leontief: Balans narodnogo khoziaistva SSSR metodologicheskii razbor rabotii TSSU Planovoe Khoziaistvo 12, 254-58 (1925)
Input-output coefficients • U = AV + ε • Regress the inputs on the outputs • Estimate the coefficients, including their confidence intervals • Need at least as many observations (firms or industries) as commodities • Published use and make tables have less industries than commodities • Then how construct input-output coefficients?
IO Analysis without the A-matrix • Productivity analysis: • Find potential output preserving the composition of final demand
The Lagrange multipliers • Tell by how much potential output increases if you add a unit to the factor constraint • Hence they are the factor productivities • Add over factors: (Total) Frontier Productivity FP • Its growth rate can be seen to be equal to the residual between potential output growth and factor input growth • It can be decomposed in industry Solow Residuals plus the terms of trade effect: FP = SR + TT • Total Factor Productivity growth TFP is the residual between actual output growth and factor input growth • TFP = FP + EC = SR + TT + EC, where EC = -(du/dt)/u
Further IO Analysis without the A-matrix • Impact of free trade: Comparative advantage and adjustment • Efficiency analysis of firms, industries and the national economy • Measurement of competition and its effect on performance Neoclassical economists argue it is positive, Schumpeter argues it is negative. The evidence is insignificant. IO Analysis decomposes departures from competition in labor rent and capital rent. Opposite effects! ten Raa The Economics of Input-Output Analysis Cambridge University Press 2005