Download
1 / 1
30 likes | 170 Vues
CATG. CATG. CATG. CATG. CATG. CATG. CATG. SAGE

E N D
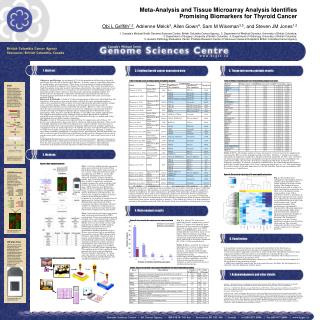
CATG CATG CATG CATG CATG CATG CATG SAGE Serial analysis of gene expression (SAGE) is a method of large-scale gene expression analysis.that involves sequencing small segments of expressed transcripts ("SAGE tags") in such a way that the number of times a SAGE tag sequence is observed is directly proportional to the abundance of the transcript from which it is derived. A description of the protocol and other references can be found at www.sagenet.org. AAA AAA AAA AAA AAA AAA AAA AAA AAA AAA AAA AAA AAA …CATGGATCGTATTAATATTCTTAACATG… GATCGTATTA 1843 Eig71Ed TTAAGAATAT 33 CG7224 cDNA Microarrays cDNA Microarrays simultaneously measure expression of large numbers of genes based on hybridization to cDNAs attached to a solid surface. Measures of expression are relative between two conditions. For more information, see www.microarrays.org. (1) (2b) (2a) (2c) AAA AAA AAA AAA AAA AAA AAA AAA AAA AAA AAA AAA AAA AAA AAA AAA AAA AAA AAA AAA (3) Affy Oligo Arrays Affymetrix oligonucleotide arrays make use of tens of thousands of carefully designed oligos to measure the expression level of thousands of genes at once. A single labeled sample is hybridized at a time and an intensity value reported. Values are the based on numerous different probes for each gene or transcript to control for non-specific binding and chip inconsistencies. Meta-Analysis and Tissue Microarray Analysis Identifies Promising Biomarkers for Thyroid Cancer Obi L Griffith1,2, Adrienne Melck3, Allen Gown4, Sam M Wiseman3,5, and Steven JM Jones1,2 1. Canada’s Michael Smith Genome Sciences Centre, British Columbia Cancer Agency; 2. Department of Medical Genetics, University of British Columbia; 3. Department of Surgery, University of British Columbia; 4. Department of Pathology, University of British Columbia; 5. Genetic Pathology Evaluation Center, Prostate Research Center of Vancouver General Hospital & British Columbia Cancer Agency 1. Abstract 3. Existing thyroid cancer expression data 5. Tissue microarray analysis results Objective and Design: An estimated 4-7% of the population will develop a clinically significant thyroid nodule during their lifetime. In many cases pre-operative diagnoses by needle biopsy are inconclusive. Thus, there is a clear need for improved diagnostic tests to distinguish malignant from benign thyroid tumors. The recent development of high throughput molecular analytic techniques should allow the rapid evaluation of new diagnostic markers. However, researchers are faced with an overwhelming number of potential markers from numerous thyroid cancer expression profiling studies. To address this we performed a systematic identification of potential thyroid cancer biomarkers from published studies by meta-analysis followed by tissue microarray analysis (TMA). Materials & Methods: A total of 21 thyroid expression studies were identified from the literature. A heuristic system was devised to identify the most promising markers, taking into consideration the number of studies reporting the potential marker, sample sizes, and fold-changes. TMAs consisting of 100 benign thyroid lesions and 105 malignant thyroid lesions were stained for 56 markers. However, only a few markers from the meta-analysis have been processed so far. Significant associations between marker staining and diagnosis (benign versus malignant) were determined using contingency table statistics and Mann-Whitney U-test (MU) test (where appropriate). The samples and markers were clustered using a simple hierarchical clustering algorithm and evaluated for their utility in classification (benign vs. malignant) using the Random Forests (RF) classifier algorithm. Results: A total of 755 genes were reported from 21 comparisons and of these, 107 genes were reported more than once with a consistent fold-change direction. This result was highly significant (p<0.0001). Comparison to a subset analysis of microarrays re-analyzed directly from raw image files found some differences but a highly significant concordance with our method (p-value = 6.47E-68). In total, 34 of the 56 markers tested on TMA were found to be significantly associated with diagnosis. Of these, 7 markers were down-regulated (malignant vs. benign) and 27 up-regulated. The RF algorithm was able to achieve a good classification of patients into their correct diagnostic group using marker score with a sensitivity of 88.5%, specificity of 94% and overall error rate of only 8.7%. Conclusion: Bioinformatics meta-analysis and tissue microarray analysis represents a powerful approach to identifying new thyroid cancer biomarkers. Additional candidates from the meta-analysis should help to develop a panel of markers with sufficient sensitivity and specificity for the diagnosis of thyroid tumors in a clinical setting. Table 1. Thyroid cancer profiling studies included in analysis Table 3. Utility of stained markers for distinguishing benign from tumor. 2. Methods Table 3: Of the 56 markers tested on tissue microarray, 33 were found to be significantly associated by MU test after multiple testing correction. Of these, 7 markers were down-regulated (in malignant compared to benign) and 26 up-regulated. To date, only 4 markers (in blue) from the meta-analysis candidates have been tested (chosen by availability, not rank) on the TMA. All four were found to be significant with three in the top 10 for diagnostic potential. A number of variables contributed to the classification performance with Gini variable importance (‘Var. Imp.’) values ranging from 0 to ~16. Not surprisingly, the relative order of variable importance in the RF classifier had strong concordance with the measures of significance. Figure 1. Meta-analysis methods Fig 1: (1) Lists of differentially expressed genes were collected and curated from published studies. Each study consists of one or more comparisons between pairs of conditions (e.g. PTC vs. norm). The following information was recorded wherever possible: Unique identifier (probe, tag, accession); gene description; gene symbol; comparison conditions; sample numbers for each condition; fold change; direction of change. (2) SAGE tags, cDNA clone ids and Affymetrix probe ids were mapped to Entrez Gene using: (a) DiscoverySpace; (b) DAVID; and (c) Affymetrix annotation files. (3) Genes were ranked according to several criteria in the following order of importance: (i) number of comparisons in agreement (ie. listing the same gene as differentially expressed and with a consistent direction of change); (ii) total number of samples for comparisons in agreement; and (iii) average fold change reported for comparisons in agreement. Fig 2: Archived thyroid cancer specimens were reviewed and selected for TMA construction. Cores were taken from each marked tumor and transferred to defined coordinates in the recipient TMA block. Blocks were cut into serial sections and transferred to slides for IHC staining. Pathologists blinded to the clinical information determined semi-quantitative marker expression scores. Scores were entered into a spreadsheet, processed by custom TMA-deconvoluter software, and finally transferred into a master study database with all clinical and pathologic patient data. Significant associations between marker staining and diagnosis were determined using contingency table statistics and Mann-Whitney U-test (MU) where appropriate. The markers were further analyzed using hierarchical clustering and Random Forests classifier algorithms. P-values were two-tailed, corrected for multiple testing (Benjamini and Hochberg), and considered significant at p<0.05. Figure 4. Hierarchical clustering of 10 most significant markers Fig. 4: All markers were submitted to the Random Forests classification algorithm with a target outcome of cancer versus benign. The Random Forests algorithm was able to achieve a good classification of patients into their correct diagnostic group using marker score with a sensitivity of 88.5%, specificity of 94% and overall error rate of only 8.7%. Specifically, this translates to a misclassification of only 6 out of 100 benign and 11 of 96 malignant samples. This performance is graphically illustrated by the good separation of benign samples (light green side bar) from the malignant (dark green side bar) samples in the hierarchical clustering heatmap. For illustrative purposes, only the 10 most significant markers are plotted in the heatmap. The color key represents marker scores from 0 (weak / negative) to 3 (strong / positive). Table 1: A total of 34 comparisons were available from 21 studies, utilizing at least 10 different expression platforms. The numbers of ‘up-/down-regulated’ genes reported are for condition 1 relative to condition 2 for each comparison as provided. Only genes that could be mapped to a common identifier were used in our subsequent analysis (see methods). Several comparison groupings were analyzed but here we will only discuss the ‘cancer vs. non-cancer’ comparison grouping. There were 21 comparisons (in blue) which compared some kind of cancer tissue with some kind of non-cancer tissue (normal or benign). *Two studies by Finley et al had significant overlap in the samples analyzed. Only the larger study was included to avoid spurious overlaps. 4. Meta-analysis results 9 Figure 3. Gene overlap for cancer vs. non-cancer analysis Fig. 3: a total of 755 genes were reported from 21 comparisons, and of these, 107 genes were reported more than once with consistent fold-change direction. In some cases (e.g., MET, TFF3, and SERPINA1), genes were independently reported as many as six times. The total amount of overlap observed was assessed by Monte Carlo simulation (represented by the red bars) and found to be highly significant (P<.0001; 10,000 permutations). Table 2: Shows a partial list of genes (identified in 4 or more comparisons) from the cancer vs. non-cancer analysis. A complete table for this group and all others are available as supplementary data (www.bcgsc.ca/bioinfo/ge/thyroid/). A review of these candidates revealed both well known thyroid cancer markers as well as relatively novel or uncharacterized genes. 6. Conclusions > A significant number of genes are consistently identified in the literature as differentially expressed between benign and malignant thyroid tissue samples. > Our meta-analysis approach represents a useful method for identifying consistent gene expression markers when raw data is unavailable (as is generally the case). > Some markers have previously undergone extensive validation while others have not yet been investigated at the protein level. > Preliminary immunohistochemistry analysis on a TMA of over 200 thyroid samples for 56 antibodies show promising results. > Additional candidate genes from the meta-analysis may facilitate the development of a clinically relevant diagnostic marker panel. Figure 2. Tissue microarray analysis methods Table 2. Cancer versus non-cancer genes identified in 4 or more independent studies 7. Acknowledgments and other details funding | Natural Sciences and Engineering Council of Canada (OG); Michael Smith Foundation for Health Research (OG, SW, and SJ); Canadian Institutes of Health Research (OG); BC Cancer Foundation references | Griffith OL, Melck A, Jones SJM, Wiseman SM. 2006. A Meta-analysis and Meta-review of Thyroid Cancer Gene Expression Profiling Studies Identifies Important Diagnostic Biomarkers. Journal of Clinical Oncology. 24(31):5043-5051. Abbreviations | ACL, Anaplastic thyroid cancer cell line; AFTN, Autonomously functioning thyroid nodules; ATC, Anaplastic thyroid cancer; CTN, Cold thyroid nodule; DTC, Differentiated thyroid cancer; FA, Follicular adenoma; FCL, Follicular carcinoma cell line; FTC, Follicular thyroid carcinoma; FVPTC, Follicular variant papillary thyroid carcinoma; GT, Goiter; HCC, Hurthle cell carcinoma; HN, Hyperplastic nodule; M, Metastatic; MACL, Anaplastic thyroid cancer cell line with metastatic capacity; MTC, Medullary thyroid carcinoma; Norm, Normal; PCL, Papillary carcinoma cell line; PTC, Papillary thyroid carcinoma; TCVPTC, Tall-cell variant papillary thyroid carcinoma; UCL, Undifferentiated carcinoma cell line For more information, see www.affymetrix.com.