AP STATISTICS REVIEW: INFERENCE
AP STATISTICS REVIEW: INFERENCE. http://carolhuss.cmswiki.wikispaces.net/ OR j.mp/husswiki. Carol Huss Independence High School carol.huss@cms.k12.nc.us. Statistical Inference. Drawing conclusions (“to infer”) about a population based upon data from a sample. Two types of inference:

AP STATISTICS REVIEW: INFERENCE
E N D
Presentation Transcript
AP STATISTICSREVIEW: INFERENCE http://carolhuss.cmswiki.wikispaces.net/ OR j.mp/husswiki Carol Huss Independence High School carol.huss@cms.k12.nc.us
Statistical Inference • Drawing conclusions (“to infer”) about a population based upon data from a sample. • Two types of inference: • Confidence intervals • Significance tests guide to inference.pdf Inference template
Confidence Intervals Confidence intervals estimate the true value of the parameter where the parameter is the true mean , true proportion p, or true slope .
Confidence Intervals • 1-sample t-interval for • 2-sample t-interval for • Matched-pairs t-interval • 1-proportion z-interval for p • 2-proportion z-interval for p1 - p2 • t-interval for slope
Confidence Intervals Patriots Are Totally Cool Students = Parameter = Assumptions (conditions) = Test name or formula = Calculations = Statement to interpret the interval
Interpret the confidence level: C% of all intervals produced using this method will capture the true mean (difference in means), or proportion (difference in proportions), or slope. (Describe the parameter in context!)
Interpret the confidence interval: I am C% confident that the true parameter (insert context) is between ___ and ___ (insert units), based on this sample.
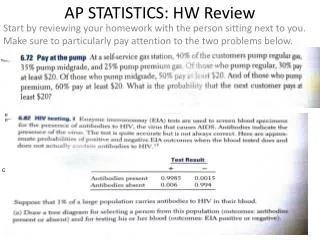
(2000) Question 6 A random sample of 400 married couples was selected from a large population of married couples. • Heights of married men are approximately normally distributed with a mean 70 inches and standard deviation 3 inches. • Heights of married women are approximately normally distributed with mean 65 inches and standard deviation 2.5 inches. • There were 20 couples in which the wife was taller than her husband, and there were 380 couples in which the wife was shorter than her husband. • Find a 95 percent confidence interval for the proportion of married couples in the population for which the wife is taller than her husband. Interpret your interval in the context of this question.
Solution (2000 – Question 6, part a) Assumption: large sample size since Parameter, Assumptions, Test Name (or formula): p = true proportion of married couples in which the wife is taller than her husband 1-proportion z-interval for p
Solution (2000 – Question 6, part a) Calculations:
Solution (2000 – Question 6, part a) Interpret the interval: I am 95% confident that the true proportion of couples in which the wife is taller than her husband is between .028 and .071, based on this sample. Correct and Incorrect Ways to Explain a Confidence Interval.docx
Significance Tests Significance tests provide evidence for some claim using sample data. test statistic = estimated value – hypothesized value standard error of the estimate
Significance Tests • 1-sample t-test for • 2-sample t-test for • Matched pairs t-test • 1-proportion z-test for p • 2-proportion z-test for p1 – p2 • Chi-square goodness-of-fit test • Chi-square test for homogeneity or independence/association • t-test for slope
Significance Tests Please Help A Totally Awesome Class Do Statistics = Parameter = Hypotheses = Assumptions (conditions) = Test name or formula = Alpha = Calculations = Decision = Statement of evidence
What is the P-value? The P-value is the probability of getting an observation as extreme or even more extreme from value of the parameter by chance alone, assuming that the null hypothesis is true. If the P-value is small (< alpha = .05), then we reject Ho. If the P-value is large (> alpha = .05), then we fail to reject Ho .
Know your inference procedures Helpful web site: http://www.ltcconline.net/greenl/java/Statistics/StatsMatch/StatsMatch.htm
Type I, Type II Errors & Power • Type I Error: Ho is true, but we reject Ho & conclude Ha • Type II Error: Ho is false, but we fail to reject Ho & fail to conclude Ha. • Power: the probability of correctly rejecting Ho
How to increase power: • Increase alpha (level of significance) • Increase the sample size, n • Decrease variability • Increase the magnitude of the effect (the difference in the hypothesized value of a parameter & its true value
QUESTIONS? Good Luck! http://j.mp/husswiki