
Low-Calorie Meatballs: Sensory Evaluation and Nutritional Analysis
This study aimed to create a low-calorie meatball suitable for those monitoring calorie intake or aiming for weight loss. Various meatball variations were produced using textured vegetable protein (TVP) and lean ground beef in different ratios: the control (25% TVP, 75% beef) and three variations (50% TVP, 50% beef; 75% TVP, 25% beef; and 100% TVP). A sensory evaluation assessed appearance, texture, aroma, flavor, aftertaste, and overall acceptability by a panel from SUNY Plattsburgh. Results showed that a 50/50 mixture of TVP and beef was the most acceptable while reducing calories and fat significantly.

Low-Calorie Meatballs: Sensory Evaluation and Nutritional Analysis
E N D
Presentation Transcript
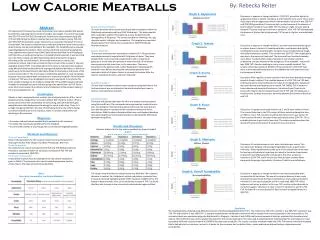
Low Calorie Meatballs By: Rebecka Reiter Graph 1: Appearance Discussion: It appears as though variation C (75% TVP) scored the highest in appearance (lower is better). Variations A and D had the same score. This is most likely due to the dry appearance of both the meatballs. Variation A was 25% TVP and 75% 95/5 ground beef. It was very dark in color because of the amount of beef involved. Variation D was 100% TVP resulting in a light, very dry looking meatball. The beef used was very lean so variation C with 75% TVP compensated the dryness of the beef by having enough TVP to give it a lighter, more desirable color. Selection of Taste Panelists Ten taste panelists were chosen according to their occupation within the Plattsburgh community and from SUNY Plattsburgh. The taste panelists were required to submit information via survey, to determine the demographics of the group. The survey included the following: sex, age, cigarette smoker, allergies, and occupation. The target group consisted of participants from food service occupations or SUNY Plattsburgh Nutrition students. Abstract The objective of this experiment was to produce a low calorie meatball that would benefit those watching calorie intake or trying to lose weight. The control was made with 25% TVP and 75% 95/5 Ground beef. Variation one was prepared using 50% TVP and 50% 95/5 ground beef. Variation two was then made by mixing 75% TVP with 25% 95/5 Ground beef. Lastly, Variation four consisted of entirely TVP and no Ground beef. The sensory evaluation was conducted using descriptive score cards to determine the overall acceptability of the meatballs. The meatballs were evaluated regarding Appearance, texture, flavor, aroma, aftertaste and overall acceptability. Taste panelists were chosen from SUNY (State University of New York) Plattsburgh and from the surrounding community. It included 10 taste panelists, 4 women and 6 men. Nutrition analysis was determined using the Nutritionist Pro program. According to the nutrient analysis, the variations decrease in calories, fat, cholesterol, sodium and protein content as they increase in the amount of textured vegetable protein (TVP). Data obtained from the sensory evaluation was analyzed using Microsoft Excel to determine the average and standard deviation, to which the graphs were formulated. Results indicated a dislike for the texture and aroma of the control and variation 3. The control was considered by panelists as most acceptable because it was was mostly beef and closest to a traditional meatball. Variations with a mixture of TVP were most acceptable is all aspects examined. In conclusion the most suitable meatball can be made by mixing 50% TVP and 50% lean ground beef. It makes the meatball less dense without giving it the beanie flavor of TVP. At the same time it also reduces the calories, fat and cholesterol of the product making it the most acceptable over all. Graph 2: Texture Discussion: It appears as though variation C was the most desired with regard to texture (lower is better). As mentioned before, easily broken but slightly crumbly texture was most desirable. Variation A was considered most tough, with little tendency to crumble. This variation was 25% TVP. The tough texture was due to the amount of lean beef. The amount of beef involved created a more dense meatball when cooked. Variation D was closely ranked as undesirable, perhaps because of the sponginess of the meatball. Variation D was 100% TVP, thereby resulting in a very coarse crumbly meatball. This analysis shows that variations B (50% TVP) and variation C (75% TVP) have more a more desirable texture due to the added amount of meat that binds the components better. Sensory Evaluation The sensory evaluation was conducted in Hawkins 027. All participants were seated around a large table with full glasses of water. They were explained the score cared and required not to talk or make facial gestures as to not sway the opinions of other panelists. All variations were prepared at the same time, in the same oven. They were presented to the panelists with a letter designation indicating which variation it was. Before receiving the next sample panelists were required to drink a full glass of water to cleanse their palate. After the sensory evaluation all score cards were collected. Graph 3: Aroma Discussion: With regard to aroma, variation A was the most desirable amongst panelists (lower is better). This could be because it is 25% TVP and 75% beef and thereby had a more traditional aroma due to it’s ingredients. Variation D was least desired and happened to be mostly TVP (100%). TVP is known to have a beanie and almost artificial aroma. Variations B and C had similar scores; this may be due to having only portions of TVP and not having such a beanie aroma. Perhaps there was a harmony between the aromas of the beef and TVP. Nutritional Analysis The low calorie meatball variations were compared using Nutritionist Pro. Nutrient analysis was scrutinized to find which meatball was lower in calories, saturated fat and sodium. Statistical Analysis The mean and standard deviation for all of the samples were calculated using Microsoft Excel. The scorecards were examined on a scale of one to four. One being the most desired quality and four was the least desired. Each box was given a number and then inputted into excel to do the calculations. With the data collected and the mean and standard deviation calculated. Graphs were formulated to better understand the differences between the qualities. Introduction Obesity is due to many factors but mostly a lack of physical activity. With a lack of physical activity, energy dense convenience foods don’t help the matter. When a person doesn’t burn the calories they are consuming, they will inherently gain weight because their bodies store the energy for use at a later time. There isn’t enough energy expenditure. One way of combating obesity is by reformulating convenience foods to be more nutritious, lower in calories and fat while still satisfying to the consumer. Graph 4: Flavor Discussion: It appears as though Variations B, C and D were similar in flavor. This is most likely due to the TVP content of these variations being that they are 50% or more, TVP. Variation C had the best flavor, but it was not far off from Variations B and D. Variation A was least liked and was 25% TVP. This is probably because it was mostly lean meat. The texture sometimes alters the quality of food and the texture of variation A was very dense. • Objectives • To create a reduced calorie meatball that is palatable to the consumer. • To reduce the overall saturated fat within the meatball. • To convey the benefits of soy through the use of textured vegetable protein. Results and Discussion Nutrient Analysis for the low calorie meatballs are found in table 2 Table 2 Nutrient Analysis for Low Calorie Meatballs Methods and Materials Source of Ingredients Most of the ingredients for this research project were purchased at the local supermarket; Price Chopper located in Plattsburgh, New York. Recipe Formulation The recipe for the control consisted of 25% TVP and 75% 95/5 ground beef. Variation 1 consisted of 50% TVP, variation 2 consisted of 75% TVP and variation 3 consisted of 100%TVP. Formulation of Scorecard A descriptive scorecard was formulated for the low calorie meatballs is given in Table 1. The characteristics rated included appearance, texture, aroma, flavor, aftertaste and overall acceptability. Graph 5: Aftertaste Discussion: All variations were similar when aftertaste was scored. This may have been because of the pungent ingredients, such as garlic onion and herbs. These ingredients were the same in all variations and are known for leaving an aftertaste in foods they are mixed in. Variation A was shown to have the least aftertaste when compared to the other variations. Variation A is25% TVP, and it may be less likely to leave a beanie flavor along with the pungent ingredients. Variation C had the most aftertaste. Graph 6: Overall Acceptability Table 1 Descriptive Scorecard for Low Calorie Meatballs The results show that the four variations are very different. The variations decrease in calories, fat, cholesterol, sodium and protein content as they increase in textured vegetable protein (TVP). Variation 3 (100% TVP) is the lowest in these amounts. Also, as the variations increase in TVP, it is found that they also increase in the amounts of carbohydrates sugar and fiber. Discussion: It appears as though variation A was most acceptable when compared to the variations. This was of no surprise because it was made mostly of beef and meats the flavors and textures of a traditional meatball. Variation D is the least acceptable, and it is made with 100% TVP. Meat replacers such as soy proteins, in this case TVP, tend to be less desirable to consumers palate. Variation C is close in score to Variation D, and it is 75% TVP. Variation B is in second place for best in overall acceptability and it is 50% TVP. Conclusion The meatballs were prepared using different amounts of textured vegetable protein (TVP). The control was 25% TVP, variation 1 was 50% TVP, variation 2 was 75% TVP and variation 3 was 100% TVP. A sensory evaluation was conducted to determine which meatball was most acceptable to the taste panelists. The nutrient analysis was conducted using the Nutritionist Pro Program. Variation 3 with 100% had the least amount of calories, saturated fat, cholesterol and sodium. Microsoft Excel was used to analyze the data from the sensory evaluation. The mean and standard deviation indicated that the control was the most acceptable while the variation made with 100%TVP was the least acceptable. The results conclude, meatballs made with 50% TVP make a low calorie meatball that is desirable to the consumer, not only is it better for the consumer but has better flavor, aroma and texture without lacking in appearance and acceptability.


