Download
1 / 1
10 likes | 238 Vues
Improvement of Moderate Redshift Quasar Surveys Utilizing Infrared and Optical Data. Ashley Stewart, Shelly Bursick, Julia Kennefick University of Arkansas S.George Djorgovski, Eilat Glikman Caltech. Introduction: What is a Quasar ? Bright centers of active galaxies.

E N D
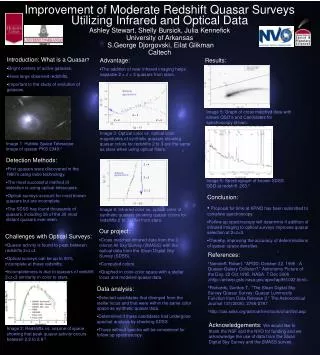
Improvement of Moderate Redshift Quasar Surveys Utilizing Infrared and Optical Data Ashley Stewart, Shelly Bursick, Julia Kennefick University of Arkansas S.George Djorgovski, Eilat Glikman Caltech • Introduction: What is a Quasar? • Bright centers of active galaxies. • Have large observed redshifts. • Important to the study of evolution of galaxies. • Advantage: • The addition of near infrared imaging helps separate 2 < z < 3 quasars from stars. Results: Image 5: Graph of cross matched data with known QSO’s and Candidates for spectroscopy shown. Z = 3 Z = 2 Z = 4 Image 3: Optical color vs. optical color magnitudes of synthetic quasars showing quasar colors for redshifts 2 to 3 are the same as stars when using optical filters. Image 1: Hubble Space Telescope image of quasar PKS 2349.1 Detection Methods: • First quasars were discovered in the 1960’s using radio technology. • The most successful method of detection is using optical telescopes. • Optical surveys account for most known quasars but are incomplete. • The SDSS has found thousands of quasars, including 26 of the 30 most distant quasars ever seen. Z = 4 Z = 3 Image 6: Spectrograph of known SDSS QSO at redshift .263.3 Z = 2 • Conclusion: • Proposal for time at KPNO has been submitted to complete spectroscopy. • Follow up spectroscopy will determine if addition of infrared imaging to optical surveys improves quasar selection at 2<z<3. • Thereby, improving the accuracy of determinations of quasar space densities. Image 4: Infrared color vs. optical color of synthetic quasars showing quasar colors for redshifts 2 to 3 differ from stars. • Our project: • Cross matched infrared data from the 2-micron All Sky Survey (2MASS) with the optical data from the Sloan Digital Sky Survey (SDSS). • Computed colors. • Graphed in color-color space with a stellar locus and modeled quasar data. • Challenges with Optical Surveys: • Quasar activity is found to peak between redshifts 2<z<3. • Optical surveys can be up to 90% incomplete at these redshifts. • Incompleteness is due to quasars of redshift 2<z<3 similarity in color to stars. References: 1Nemiroff, Robert. "APOD: October 22, 1995 - A Quasar-Galaxy Collision?." Astronomy Picture of the Day. 22 Oct 1995. NASA. 7 Dec 2006 <http://antwrp.gsfc.nasa.gov/apod/ap951022.html> 2Richards, Gordon T.. "The Sloan Digital Sky Survey Quasar Survey: Quasar Luminosity Function from Data Release 3." The Astronomical Journal 131(2006): 2766-2787. 3http://cas.sdss.org/astrodr5/en/tools/chart/list.asp • Data analysis: • Selected candidates that diverged from the stellar locus and that were within the same color space as synthetic quasar data. • Determined if these candidates had undergone spectral analysis by checking SDSS. • Those without spectra will be considered for follow up spectroscopy. Acknowledgements: We would like to thank the NSF and the NVO for funding and we acknowledge the use of data from the Sloan Digital Sky Survey and the 2MASS survey. Image 2: Redshifts vs. volume of space showing that peak quasar activity occurs between 2.2 to 2.8.2