Product Development Prioritization Tool
40 likes | 71 Vues
Get this template plus 350 other premium business tools & templates at www.demandmetric.com

Product Development Prioritization Tool
E N D
Presentation Transcript
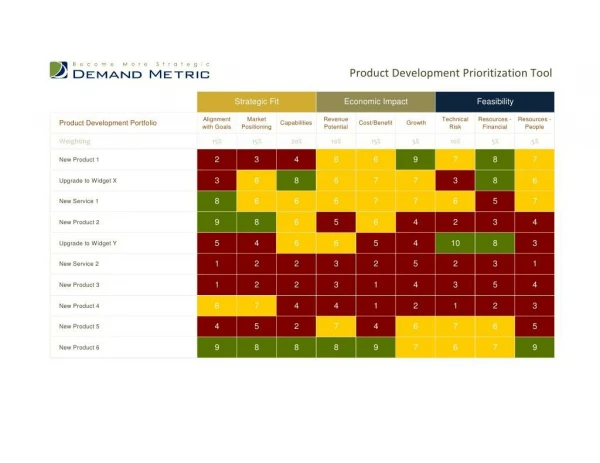
Product Development Prioritization Tool Product Development Prioritization Tool Strategic Fit Economic Impact Feasibility Alignment Market Revenue Technical Resources - Resources -Product Development Portfolio with Goals Positioning Capabilities Potential Cost/Benefit Growth Risk Financial PeopleWeighting 15% 15% 20% 10% 15% 5% 10% 5% 5%New Product 1 2 3 4 6 6 9 7 8 7Upgrade to Widget X 3 6 8 6 7 7 3 8 6New Service 1 8 6 6 6 7 7 6 5 7New Product 2 9 8 6 5 6 4 2 3 4Upgrade to Widget Y 5 4 6 6 5 4 10 8 3New Service 2 1 2 2 3 2 5 2 3 1New Product 3 1 2 2 3 1 4 3 5 4New Product 4 6 7 4 4 1 2 1 2 3New Product 5 4 5 2 7 4 6 7 6 5New Product 6 9 8 8 8 9 7 6 7 9
Product Development Prioritization Tool Weighting Scale Strategic Fit Economic Impact Feasibility TotalAlignment with Market Revenue Resources - Resources - Capabilities Cost/Benefit Growth Technical Risk Goals Positioning Potential Financial People 15% 15% 20% 10% 15% 5% 10% 5% 5% 100% Ranking Criteria & Definitions: Alignement with Goals - how aligned is this project to corporate goals & objectives? Market Positioning - does this initiative position us better in the market? Capabilities - does this initiative leverage our core capabilities (technology, operations, sales)? Revenue Potential - what is the short-term revenue potential for this initiative. Cost/Benefit Ratio - does this initiative have a solid cost/benefit ratio? Growth - do you see this marketing growing heavily in the next few years? Technical Risk - what is the probability of overcoming the technical challenges of the project? Resources - Financial - do we have the financial resources to execute this initiative? Resources - People - do we have the skills & bandwidth to execute this initiative? Product Development Prioritization Tool Weighting Scale Strategic Fit Economic Impact Feasibility TotalAlignment with Market Revenue Resources - Resources - Capabilities Cost/Benefit Growth Technical Risk Goals Positioning Potential Financial People 15% 15% 20% 10% 15% 5% 10% 5% 5% 100% Ranking Criteria & Definitions: Alignement with Goals - how aligned is this project to corporate goals & objectives? Market Positioning - does this initiative position us better in the market? Capabilities - does this initiative leverage our core capabilities (technology, operations, sales)? Revenue Potential - what is the short-term revenue potential for this initiative. Cost/Benefit Ratio - does this initiative have a solid cost/benefit ratio? Growth - do you see this marketing growing heavily in the next few years? Technical Risk - what is the probability of overcoming the technical challenges of the project? Resources - Financial - do we have the financial resources to execute this initiative? Resources - People - do we have the skills & bandwidth to execute this initiative?
Product Development Prioritization ToolNote: Sort by selecting all cells then click "Data"in the navigation menu and "Sort". You can sort by Overall Score (Largest to Smallest). Product Development Portfolio Opportunities Overall Score Strategic Fit Economic Impact Feasibility New Product 6 8.1 4.2 2.5 1.4 New Product 1 5.0 1.6 2.0 1.5 Upgrade to Widget X 6.0 3.0 2.0 1.0 New Service 1 6.5 3.3 2.0 1.2 New Product 2 5.9 3.8 1.6 0.6 Upgrade to Widget Y 5.7 2.6 1.6 1.6 New Product 5 4.6 1.8 1.6 1.3 New Product 4 3.8 2.8 0.7 0.4 New Product 3 2.3 0.9 0.7 0.8 New Service 2 2.1 0.9 0.9 0.4 Product Development Prioritization ToolNote: Sort by selecting all cells then click "Data"in the navigation menu and "Sort". You can sort by Overall Score (Largest to Smallest). Product Development Portfolio Opportunities Overall Score Strategic Fit Economic Impact Feasibility New Product 6 8.1 4.2 2.5 1.4 New Product 1 5.0 1.6 2.0 1.5 Upgrade to Widget X 6.0 3.0 2.0 1.0 New Service 1 6.5 3.3 2.0 1.2 New Product 2 5.9 3.8 1.6 0.6 Upgrade to Widget Y 5.7 2.6 1.6 1.6 New Product 5 4.6 1.8 1.6 1.3 New Product 4 3.8 2.8 0.7 0.4 New Product 3 2.3 0.9 0.7 0.8 New Service 2 2.1 0.9 0.9 0.4
Projects to Cut DevelopmentHigh Upgrade to Widget Y New Product 1 New Product 6 New Product 5 New Service 1 Bubble Size = Economic ImpactFeasibility Upgrade to Widget X New Product 3 New Product 2 New Service 2 New Product 4Low Low Value Projects Low Hanging Fruit Low High Strategic Fit Projects to Cut DevelopmentHigh Upgrade to Widget Y New Product 1 New Product 6 New Product 5 New Service 1 Bubble Size = Economic ImpactFeasibility Upgrade to Widget X New Product 3 New Product 2 New Service 2 New Product 4Low Low Value Projects Low Hanging Fruit Low High Strategic Fit