Product Profitability Analysis Tool
20 likes | 114 Vues
Get this template plus 350 other premium business tools & templates at www.demandmetric.com

Product Profitability Analysis Tool
E N D
Presentation Transcript
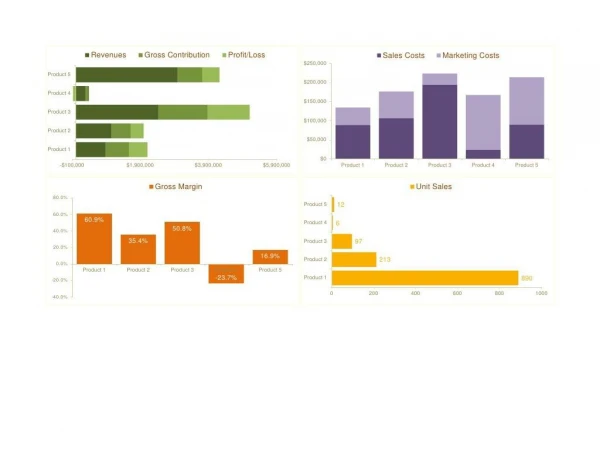
Product Profitability Analysis Tool Revenues Gross Contribution Profit/Loss Sales Costs Marketing Costs $250,000Product 5 $200,000Product 4 $150,000Product 3 $100,000Product 2 $50,000Product 1 $0 -$100,000 $1,900,000 $3,900,000 $5,900,000 Product 1 Product 2 Product 3 Product 4 Product 5 Gross Margin Unit Sales 80.0% Product 5 12 60.0% 60.9% Product 4 6 40.0% 50.8% 35.4% Product 3 97 20.0% 16.9% 0.0% Product 2 213 Product 1 Product 2 Product 3 Product 4 Product 5 -20.0% -23.7% Product 1 890 0 200 400 600 800 1000 -40.0%
Product Profitability Analysis Tool Gross MarketingProducts Price Unit Cost Unit Sales Revenues COGS* Sales Costs** Profit/Loss Gross Margin Contribution CostsProduct 1 $1,000 $240 890 $890,000 $213,600 $676,400 $45,600 $89,000 $541,800 60.9%Product 2 $5,000 $2,400 213 $1,065,000 $511,200 $553,800 $69,900 $106,500 $377,400 35.4%Product 3 $25,000 $10,000 97 $2,425,000 $970,000 $1,455,000 $29,750 $194,000 $1,231,250 50.8%Product 4 $50,000 $34,000 6 $300,000 $204,000 $96,000 $143,000 $24,000 -$71,000 -23.7%Product 5 $250,000 $190,000 12 $3,000,000 $2,280,000 $720,000 $123,450 $90,000 $506,550 16.9%* COGS - Cost of Goods Sold before Sales & Marketing costs.** Sales Costs - formulas need to be updated to reflect your sales commission percentages. Currently, there is a default 10% sales commission in the formula. Product Profitability Analysis Tool Gross MarketingProducts Price Unit Cost Unit Sales Revenues COGS* Sales Costs** Profit/Loss Gross Margin Contribution CostsProduct 1 $1,000 $240 890 $890,000 $213,600 $676,400 $45,600 $89,000 $541,800 60.9%Product 2 $5,000 $2,400 213 $1,065,000 $511,200 $553,800 $69,900 $106,500 $377,400 35.4%Product 3 $25,000 $10,000 97 $2,425,000 $970,000 $1,455,000 $29,750 $194,000 $1,231,250 50.8%Product 4 $50,000 $34,000 6 $300,000 $204,000 $96,000 $143,000 $24,000 -$71,000 -23.7%Product 5 $250,000 $190,000 12 $3,000,000 $2,280,000 $720,000 $123,450 $90,000 $506,550 16.9%* COGS - Cost of Goods Sold before Sales & Marketing costs.** Sales Costs - formulas need to be updated to reflect your sales commission percentages. Currently, there is a default 10% sales commission in the formula.