Unfolding with system identification
270 likes | 294 Vues
Learn about system identification using the unfolding procedure for dynamic systems analysis. Understand the basic equations and numerical examples. Explore Monte-Carlo simulations and regularization techniques for effective parameter calculation.

Unfolding with system identification
E N D
Presentation Transcript
Unfolding with system identification Nikolai Gagunashvili Faculty of Information Technology, University of Akureyri, Iceland nikolai@unak.is PHYSTAT 05 Oxford, UK
Contents • Introduction • Basic equation • System identification • The unfolding procedure • A numerical example • Conclusions • References PHYSTAT 05 Oxford, UK
Introduction PHYSTAT 05 Oxford, UK
Introduction (cont.) PHYSTAT 05 Oxford, UK
Basic equation We will use the linear model for the transformation of a true distribution to the measured one where f= (f1,f2,….,fm)T is vector of an experimentally measured histogram content, φ= (φ1, φ2,..,φn)T is vector of some true histogram content, ε = (ε1, ε2,.....εm)T is vector of random residual components with mean value equal to 0, and diagonal variance matrix, where σ1,.... σm are the statistical errors of measured distribution. is the matrix of transformation PHYSTAT 05 Oxford, UK
Basic equation (cont.) PHYSTAT 05 Oxford, UK
Basic equation (cont.) A Least Squares Method can give an estimator of the true distribution where , the estimator, is called the unfolded distribution. The full matrix of errors of the unfolded distribution is according to the Least Squares Method. PHYSTAT 05 Oxford, UK
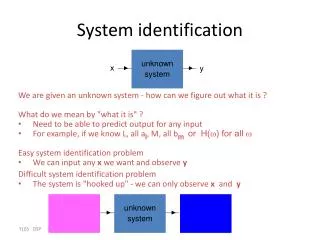
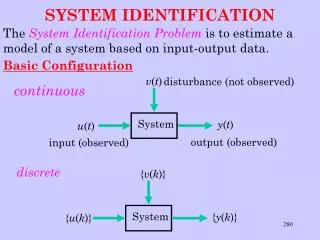
There are two stage of solving unfolding (inverse) problem: 1. Investigation and calculation matrix P known as problem of identification system and may be defined as the process of determining a model of a dynamic system using observed input-output data. 2. Solution of equation (1) that gives unfolded function with complete matrix of statistical errors of . PHYSTAT 05 Oxford, UK
System identification or calculation of matrix P The Monte-Carlo simulation of a set-up can be used for identification to get input-output data. Most popular input control signals are step control signal and impulse control signal. Matrix can be calculated with usage impulse control signals for identification. Equation (1), with the matrix calculated this way, gives a high fluctuated unfolded distribution with large statistical errors. Also it is possible that solution does not exist because matrix is singular. PHYSTAT 05 Oxford, UK
System identification or calculation of matrix P Regularization of solution (1) can be achieved if we will use for the system identification not an impulse control distribution, but an a priori distributions that may be known from theory, or from some other experimental data or can be proposed hypothetically. Assume we have q control generated distributions, and present them as matrix where each row represents one control generated histogram. PHYSTAT 05 Oxford, UK
System identification or calculation of matrix P For each i-th row of the matrix P we can write the equation where is a vector of reconstructed i-th bin content for different generated control distributions, is a vector of random residuals with expectation value equal to 0 and diagonal variance matrix where is the statistical error of the reconstructed distribution for the i-th bin and j-th control generated distribution. Least Squares Method gives and estimator for pi PHYSTAT 05 Oxford, UK
System identification or calculation of matrix P Columns of matrix can correlate with each other. It means that transformation of the control generated distribution to the i-th bin of reconstructed distribution can be parameterized by subset of elements of the row pi. May be more than one subset that describes this transformation in sufficiently good manner. Example: PHYSTAT 05 Oxford, UK
System identification or calculation of matrix P Thus for each i-threconstructed bin we will have Ni candidate rows, and for all reconstructed bins candidate matrices P. We need to choose a matrix P that is good, or optimal , in some sense. The most convenient in this case is the criteria of D-optimality that is related to the minimization of determinant of full matrix of errors of unfolded distribution PHYSTAT 05 Oxford, UK
System identification or calculation of matrix P • Main advantages D-optimization • Minimizes the generalized variance of the components of an unfolded distribution • Minimizes the volume of the confidence ellipsoid for this distribution • There are many computer algorithms for optimization. • Further optimization can be achieved by introducing selection criteria for control generated distributions used for identification. PHYSTAT 05 Oxford, UK
System identification or calculation of matrix P Selection criteria for control generated distributions A control generated distribution has corresponding the reconstructed control distribution that can be compared with the experimentally measured distribution by χ2 test. Let us take for identification a generated distribution that has a corresponding reconstructed distribution satisfying a χ2<aselection criteria. The parameter a defines a significant level p(a)for the comparison of two histograms. Application of this selection criteria increase number of candidate matrix P and can decrease value of determinant of full matrix of errors and statistical errors of unfolded distribution. PHYSTAT 05 Oxford, UK
System identification or calculation of matrix P Experimental distribution Monte-Carlo Set of generated control distributions Set of reconstructed control distributions PHYSTAT 05 Oxford, UK
The unfolding procedure • Initialization • Define a binning for experimental data. • Define a binning for the unfolding distribution. • System identification • Choose a set of control generated distributions. • Calculate the set of candidates for the matrix P. • Calculate the D-optimal matrix P. • Basic equation solution • Calculate unfolded distribution with full matrix of errors • Test of goodness of the unfolding • Fit unfolded distribution and compare the experimental distribution and the reconstructed simulated distribution PHYSTAT 05 Oxford, UK
The unfolding procedure • Initialization • Define a binning for experimental data PHYSTAT 05 Oxford, UK
The unfolding procedure • Initialization • Define a binning for the unfolded distribution PHYSTAT 05 Oxford, UK
A numerical example We take a true distribution with parameters An experimentally measured distribution is defined as where the acceptance and is the detector resolution function with σ=1.5. PHYSTAT 05 Oxford, UK
An example of the true distribution φ(x), the acceptance function A(x) and the resolution function R(x,10) PHYSTAT 05 Oxford, UK
An example of the measured distribution f PHYSTAT 05 Oxford, UK
A numerical example (cont.) A histogram of the measured distribution was obtained by simulating 104 events. Random parameters are generated uniformly on the intervals [1,3] for A1; [0.5,1.5] for A2; [8,12] for B1 ; [10,18] for B2; [0.5,1.5] for C1; [0.5,1.5] for C2; which define a distribution for identification. PHYSTAT 05 Oxford, UK
Control distributions generated for system identification and an unfolded distribution for different χ2 cut PHYSTAT 05 Oxford, UK
Conclusions • The proposed method use of a set of a priori distributions for identification to obtain stable solution of unfolding problem. • D-optimization and the application of the Least Squares Method gives the possibility of minimizing the statistical errors of the solution. • χ2 selection criteria permits to decrease the possible bias of the procedure. • The procedure has no restriction due to dimensionality of the problem. • The procedure can be applied for solving unfolding problem with smooth solution as well as non-smooth solution. • Based only on a statistical approach the method has a good statistical interpretation. PHYSTAT 05 Oxford, UK
References • V.Blobel,Unfolding methods in high-energy physics experiments, CERN 85-02 (1985). • V.P.Zhigunov, Improvement of resolution function as an inverse problem, Nucl. Instrum. Meth. 216(1983)183. • A.Höcker,V.Kartvelishvili, SVD approach to data unfolding, Nucl. Instrum. Meth.A372(1996)469. • N.D.Gagunashvili, Unfoldingof true distributions fromexperimental data distorted by detectors with finiteresolutions, Nucl. Instrum. Meth.A451(1993)657. • N.D.Gagunashvili, test for comparison of weighted and unweighted histograms, PHYSTAT 05 Oxford,UK PHYSTAT 05 Oxford, UK