Download
1 / 23
230 likes | 351 Vues
Growth in international trade. Caused greater reliance on intermodal connections, ports, and air terminals. Growth not from neighbors. Major Gateways. Logistics Cost. Professor Goodchild Spring 09. How do goods get to market?. West Coast Port. Asian Factories. Distribution Center.

E N D
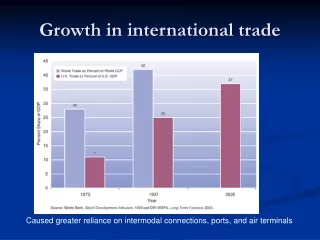
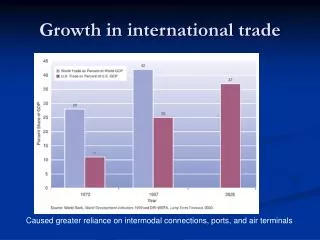
Growth in international trade Caused greater reliance on intermodal connections, ports, and air terminals
Logistics Cost Professor Goodchild Spring 09
How do goods get to market? West Coast Port Asian Factories Distribution Center Destination Store Container on marine vessel Short or Long-haul truck Drayage truck Transportation cost is typically much less significant than the reductions in manufacturing.
Logistics Costs • Transportation cost • The cost incurred through the need to move products over space. • In a vehicle, with a forklift, etc. • Inventory cost • The cost incurred through the need to hold goods over time. • In a vehicle, in a distribution center, etc.
In-transit inventory or pipeline inventory: inventory that is in the process of movement from point of receipt or production and between points of storage and distribution. • Inventory-at-rest: inventory that is NOT in the process of movement from point of receipt or production and between points of storage and distribution, rather it is stationary, typically at a production facility, warehouse, distribution center, or consumption facility.
How does REI get goods to market? West Coast Port Asian Factories Distribution Center Destination Store Container on marine vessel Short or Long-haul truck Drayage truck In transit inventory
Initial gains from deregulation (restructuring of networks), stalling in the mid-90s dropping off again after 9/11, but increasing with congestion and fuel prices After 2003.
Follow the path of an item • Carried from production area to storage area • Held in temporary storage • Loaded into transport vehicle • Transported to the destination • Unloaded, handled, and held for consumption
What incurs cost? • Overcoming distance (motion): • transportation cost (over the road/rail) • handling cost (through a terminal, in and out of vehicles) • Overcoming time (holding): • holding cost: • Rent (proportional to D’H) • Waiting (value*time*interest rate) • In transit • pipeline How you calculate the value depends on the analysis you are doing (cost or price) We will include all costs, regardless of who pays them (we are designing systems)
Cumulative Number of Items Diagram Production (rate D’) shipments cumulative number of items An item is a fixed quantity of infinitely divisible quantity (e.g. person, parcel, case of beer) H tm Consumption (D’) arrivals time Consider units on area
Queue Discipline • FIFO: First In First Out • LIFO: Last In First Out • Others If LIFO inventory cost is usually underestimated
Holding cost: Rent • proportional to max. accumulation • Independent of flow rate, D’ • Proportional to max. time between dispatches
Holding cost: Waiting • Cost associated with delay to items • ciHi + citm • Stationary + pipeline inventory • Determining ci is difficult
Transportation Cost • Shipment cost has fixed and variable portions: cf + cvv (v is number of items) • Fixed cost: driver wage • Variable cost: increased fuel consumption • Cost for n shipments: cfn + cvV (V is total items across shipments, n is number of shipments)
Transportation cost • Cost per item: (cfn + cvV)/V = cf/vavg+cv • Economies of scale from sharing fixed cost • vavg=D’Havg so cost per item is (cf/D’Havg)+cv • Transportation cost decreases with increasing average headway • Holding cost increased with maximum headway • Therefore shipments should be spread so as to minimize the maximum (all the same)
Transportation cost and distance • cf (fixed shipment cost) is independent of v (items) • both cf and cv are typically functions of distance (d) • cf=cs+cdd • cv=c’s+c’dd • Cost for n shipments: cfn+cvV • csn+cddn+c’sV+c’ddV • Add cost of multiple stops: cs(1+ns)n+cddn+c’sV+c’ddV So small we neglect it
Transportation cost • Cost per item (divide by nvavg): • cs(1+ns)/vavg+cdd/vavg+c’s or • cs(1+ns)/D’Havg+cdd/D’Havg+c’s • If headways vary a lot so do shipment sizes, and therefore truck sizes, better to use consistent truck sizes (second reason to keep shipment sizes consistent)
Capacity Restrictions Trans. Cost Per shipment vcv cf Slope is cost per item, lowest when truck full vmax – number of items that will fit in vehicle shipment size
Relationship to size Magnitude of fixed and variable cost determine most economic choice as a function of shipment size. Trans. Cost Per shipment As shipment size increases, favor lower variableand higher fixed costs. shipment size