Download
1 / 23
230 likes | 366 Vues
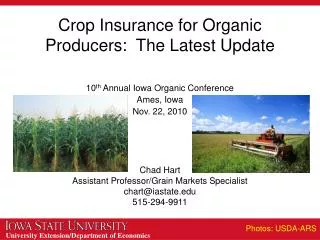
2012 Crop Insurance Update Overview. Feb. 21, 2012 George Patrick Purdue University For specific information, contact a crop insurance agent. Reference. http:// www.farmdoc.illinois.edu/ cropins /index.asp Premium calculator “What if?” Analysis of developments RMA/FCIC Handbook.

E N D
2012 Crop Insurance UpdateOverview • Feb. 21, 2012 • George Patrick • Purdue University • For specific information, contact a crop insurance agent
Reference • http://www.farmdoc.illinois.edu/ cropins/index.asp • Premium calculator • “What if?” • Analysis of developments • RMA/FCIC Handbook
Changes in 2011 • Reduced insurance programs available for corn and soybeans • Combined CRC and RA (COMBO) • Eliminated Income Protection Plan (IP) • Established uniformity in prices used across policies
2011 Prices used in IN • Corn • Projected – Dec. futures in Feb. $6.01 • Harvest – Dec. futures in Oct. $6.32 • Soybeans • Projected – Nov. futures in Feb. $13.43 • Harvest – Nov. futures in Oct. $12.14 • Use the hlgher of projected or harvest prices Limit of 2X price increase
Effects of price increases on revenue products • Corn price increased by $0.31 to $6.32/bu. (4.9% increase) • Volatility affects price changes – greater volatility-larger changes • Higher price increases the insurance guarantee level (bushels X price) • Any indemnity is paid at higher price
Effects of price reductions on revenue products • “Use higher of projected or harvest price” • Soybean price decrease of $1.29 (9.6%) from spring (projected) to harvest results in guarantee level using $13.43 • Producer has nearly a 10% revenue loss on price alone • Any indemnity is paid at the $13.43 rate
Premium subsidy increased for enterprise unit • Insurance unit • Basic unit (land owned or share leased from a landowner) • Optional (divides into smaller units) • Enterprise unit all of crop within the county
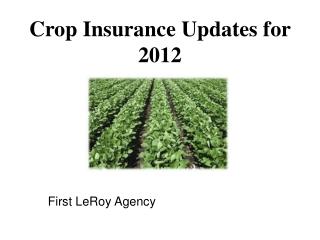
Changes for 2012 • Price change effect on crop insurance costs • Premium rate changes • Effect of trend yield adjustment • Effect on insurance in 2012
‘12 Premium Rate Changes • Loss ratio has been below target rate for much of the Corn Belt • IN premium rates have been adjusted downward an average • - 11 % for corn • - 7 % for soybeans
2012 Projected Prices • Based on settlement prices for Feb. Have only first two weeks of Feb. • Corn $5.74 v. $6.01 • Beans $12.35 v. $13.39 • Trend adjusted coverage in ‘12 • Corn slightly up, beans slightly down
Trend Adjusted Yield • Indiana Corn Yields • Yields increase about 2 bu./yr • 10-year average of actual yield underestimates next year’s corn yield by about 10 bushels • % coverage level is over stated
Trend Adjusted Yield • Corn producer with a 10-year APH yield of 175 bu. and county yield trend of 2 bu./yr. has expected yield of 185 bu. • 75% of 185 bu. = 138.75 bu. • 75% of 175 bu. = 131.25 bu.
Figure 1. Actual Corn Yields in Bu/Acre, Randolph County, 1965-07
Figure 2. Actual and Trend Corn Yields in Bu./Acre Randolph County 1965-07 (trend 1.7 bu/year)
Figure 3. Actual Corn Yields as a Percent of Trend, Randolph County 1965-07
Detrending Procedure • Does a good job of helping a producer better understand the magnitude and frequency of losses. • Does not correct very well for the decreasing level of protection
Procedures • Get about 40 years of county yield data • Estimate regression to determine trend for farms in the county • Adjust past crop insurance yields • Recompute yield guarantee and insurance premium
TA Yield Determination • Assume 170 bu. average yield with 2 bu./yr. trend • Have yields for 7 years – • 2005 to 2011 • Determine TA yield for 2012
TA Yield – Trigger Yield and Increased Premium • Regular yield 75% 127.5 bu. • TA yield 75% 133.5 bu. • Yield prot 75% 11.14 v. 11.17 • COMBO 75% 21.39 v. 21.65