Environmental Technology Verification Program
Environmental Technology Verification Program. Teresa Harten, ETV Director Environmental Technology Council Brown Bag Briefing September 23, 2004. ETV Objectives. Provide credible performance information for commercial ready technology to help solve high risk environmental problems. Aid:

Environmental Technology Verification Program
E N D
Presentation Transcript
Environmental Technology Verification Program Teresa Harten, ETV Director Environmental Technology Council Brown Bag Briefing September 23, 2004
ETV Objectives • Provide credible performance information for commercial ready technology to help solve high risk environmental problems. Aid: • Purchasers in making decisions to purchase innovative technologies • Permitters in making permitting decisions for innovative technologies, and • Vendors/developers in selling and further developing innovative technologies
ETV helps technology commercialization and innovation Research Proof of Development Demonstration Verification Commercialization/ Concept Deployment
Verification definition • To establish or prove the truth of the performance of a technology under specific, predetermined criteria or protocols and adequate QA procedures. • ETV does not: • Pass / fail, • Approve, or • Certify technologies
ETV Verification Process Develop test protocols, Quality Assurance test plans Conduct technology testing EPA, verification organizations, stakeholders Identify vendors, collaborators Write verification report Identify technology categories www.epa.gov/etv ETV Outreach
ETV Quality Assurance • ETV follows ANSI E4 standards for environmental technology evaluation. • Quality Planning and Implementation • Program Quality Management Plan • Center-specific QMPs • Test-Specific Quality Assurance Project Plans (test plans) • Reviews and audits by EPA and Center QA staff • Science Advisory Board in 2000 review of ETV commended ETV for QA procedures and implementation.
ETV Successes • 281 Verifications, 78 protocols • Supports solving important environmental problems • Increasing: • Funding from vendors and other partners over 50% from others (25% cash and 25% in-kind) • Stakeholder participation - 805 stakeholders in 21 groups • Web and International interest – 1.5M hits/yr • Important role homeland security
6 ETV Centers 2004 • ETV Air PollutionControl Technology Center RTI International • ETV Drinking Water Systems Center NSF International • ETV Greenhouse Gas Technology Center Southern Research Institute • ETV Water QualityProtection CenterNSF International • ETV AdvancedMonitoring Systems Center Battelle • ETV- Building Decontamination Center Battelle • ETV P2 Coatingsand Coating Equipment Pilot Concurrent Technologies Corporation
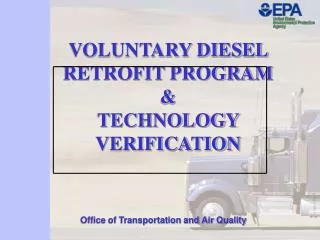
Major verification categories planned for FY 04 and 05 – Base ETV • Monitoring and detection • Rapid and/or continuous emission monitors for mercury, ammonia, dioxin monitors, and beach pathogens • Drinking water • Removal of pathogens, disinfection byproducts, and arsenic • Air pollution control • Diesel engine retrofit technology, dust suppressants, baghouse filtration products • Greenhouse gas reduction • Fuel cells, microturbines with combined heat and power, waste to energy systems • Water quality protection • Water infrastructure rehabilitation, Ballast water treatment, Storm water treatment technologies, Animal waste treatment • Pollution prevention • Low emissions coatings and equipment
ETV partners with … • US National Oceanic and Atmospheric Administration • Multi-parameter water probes • US Coast Guard • Ballast water treatment • US Dept of Energy, Massachusetts, Connecticut, Illinois Clean Coal Institute • Continuous emission mercury monitors • US Dept of Defense • Monitors for explosives; PCBs in soils; dust suppressants • States of Alaska, Pennsylvania • Drinking water arsenic treatment • States/counties in Georgia, Kentucky, Michigan • Storm water treatment • States of New York, Colorado • Waste to energy • US Dept of Agriculture • Ambient ammonia monitors
Note: There were 88,665 total hits and 9,726 international hits in August 2004. Total Hits International Hits www.epa.gov/etv Hits/Quarter (1998) (1999) (2000) (2001) (2002) (2003) (2004)
Getting to ETV OutcomesMeasuring outputs to outcomes Outputs Outcomes • Number of protocols and verifications • Value placed on ETV by vendors in selling and innovating technology • Value to potential buyers and regulators; influence of ETV on purchase and permitting decisions • Use of better technologies; reduced emissions because of ETV • Reduced exposure; reduced risk because of ETV • Improved health/environmental quality because of ETV
Case Studies Publication(intermediate to long term outcomes) • Case Studies to include: • Environmental problem and regulatory background • State of the practice • Performance of the verified technology • Projections for pollutant reduction based on market penetration scenarios • Sales, permitter and purchaser info to gauge implementation (thru literature, direct feedback, or surveys)
Selecting Priority Technologies for Verification • Outcomes projected ahead of technology selection. • Environmental problem and regulatory background • State of the practice • Performance claims for the technology candidate • Projections for pollutant reduction based on market penetration scenarios • Potential for risk reduction (include uncertainty reduction) /environmental improvement)
ETV Program Funding and Outputs(does not include ETV-Homeland Security) • Begin your presentation here
Potential Matches to ETC prioritiesETV Contacts and Centers • Bob Fuerst – Advanced Monitoring Systems Center • Remote Sensing • Methods for Detecting Infectious Organisms in Drinking Water • Prevention of Pollutants from CAFOs • Field Instrumentation to Screen Detect Pollutants • Continuous Air Monitors for Fine Particulates • Dave Kirchgessner – Greenhouse Gas Reduction Center • Gasification of Waste Material to Energy • Integrated Gasification Combined Cycle and Carbon Capture and Sequestration • Prevention of Pollution at CAFOs
Potential Matches to ETC prioritiesETV Contacts and Centers • Jeff Adams – Drinking Water Systems Center • Arsenic MCL Compliance for Small Drinking Water Systems • Ray Frederick – Water Quality Protection Center • Prevention of Pollution from CAFOs • Urban Runoff • Improved Pesticide Application Equipment to Reduce Inadvertent Pesticide Residues in Environment • Mike Kosusko – Air Pollution Control Technology Center • Improved Pesticide Application Equipment to Reduce Inadvertent Pesticide Residues in Environment
Integrating Sustainabilityinto ETV • ETV is part of the Pollution Prevention and New Technology Multi Year Plan which is transitioning to the Science and Technology for Sustainability MYP • Sustainability relies on systems approaches • ETV evaluations now are a snapshot in time: testing period is usually a couple weeks to a year • To address sustainability, performance characteristics could be broadened to include: • cross media pollution (if not already) • impacts over time • is technology a “clean” or “environmentally preferable” product? RCRA PBTs avoided, recyclability, and reusability, for example
Case StudyMercury Continuous Emissions Monitors (AMS) • Environmental/public health issue – Mercury is toxic and teratogenic. • 158 tons/yr Mercury emitted from man-made sources; 87% comes from combustion sources. 43 tons from coal-fired power plants • Regulatory MACT or Cap and Trade options, both require reliable monitoring • In 2001 and 2003, Nine CEMs (based on AA, AF, or AE) were verified by ETV • Phase 1 - simulated coal-fired flue gas • Phase 2 - full scale incinerator • Phase 3 - planned at full scale coal-fired power plant • Horiba Instruments reports: • ETV led to sales of several units and negotiations underway for more sales. • Has reported on ETV results at major mercury conferences • Interest in Phase 3 testing • Envimetrics, Inc and Ohio Lumex report: • Used ETV results for further innovations and interested in Phase 3 testing.
Case StudyPortable Arsenic Monitors/Test Kits (AMS) • USGS mapping of US groundwater shows 25% of samples have elevated arsenic • Problem in SE/ south central Asia: Bangladesh has over 11 million wells that must be monitored continually for arsenic safety • US DW limit lowered from 50ppb to 10ppb; compliance by January 2006. • In 2002 and 2003, nine were verified by ETV - field portable , colorimetric or voltammetric • ES&T article reviewing screening techniques for arsenic referenced the ETV verifications and results • Arsenic Crisis group listserve on Yahoo circulated ETV results at least twice • ETV arsenic reports are being considered now as primary source of info for technologies in Bangladesh where previous study had indicated many false negatives in screening methods used. • Industrial Test Systems had 5 As technologies verified under ETV, reports: • More than 10% of sales calls inquiries reference ETV • At least 11% of sales can be directly attributed to ETV and more “in part” attributable to ETV • Vendor plans to participate in ETV in future for other technology categories.
Case Study Residential Nutrient Reduction (WQP) • Performance of onsite wastewater treatment systems has gained importance – impact on public health and the environment of inadequate treatment. • Reduction of nutrients is important to keep nitrates out of drinking water sources for public health protection and all waterways for water quality protection. • Five technologies were verified by ETV in 2003, from Aquapoint, Inc; Biomicrobics; FR Mahoney & Assoc; SeptiTech, inc, and Waterloo Biofilter. • Nitrogen was reduced from 50 to 65%. • State and local regulators use ETV • State of N. Carolina requires ETV protocol for testing onsite systems to be considered for innovative approval. Sixth technology, Bioconcepts, is being verified to meet N Carolina requirements. • Potential environmental impact – US Census data: 24.7 M septic tanks. Assume 50% nitrogen removal by ETV technologies yields 46K to 184K tons/yr N reduced at 25 to 100% market penetration.
Case Study Disinfection By-Product Treatment (DWS) • Disinfection By-Products are linked to bladder, colon, and rectal cancers, possible links to reproductive and neurological disease. • Stage 2 Microbial and Disinfection By-Products Rule will lower limit of DPB. EPA estimates that for bladder cancer annualized benefits will be $0 to $986M. 2.8% of all plants will need to add treatment to comply. • ETV verified PCI membrane system nanofiltration system in Barrow, Alaska to remove 94% of total trihalomethane and 98% of haloacetic acid. • Marketing impact: PCI reports that it sold four systems after ETV verification and saved $120,000 in eliminated pilot testing. • PCI estimates that there are 200 to 250 potential sites to apply the technology in Alaska alone; other sites exist in Washington, Oregon, Maine, Vermont, and New Hampshire.
Case Study Oil and Gas - Vapor Recovery (GHG) • 252,000 natural gas and 575,000 crude oil wells in US • Most employ condensate storage tanks which produce large volumes of HC vapors • EPA estimates 30 billion cubic feet vented annually • In 2002, ETV verified COMM Engineering’s non-mechanical eductor or jet pump that recovers gas from tanks (also reduces or eliminates emissions of GHG, VOC, and other constituents of vent gas) • Reduced emissions by 678 tons/yr and HAPs by 176 tons/yr • Value of recovered gas in 2002 - $350,000; 4 month payback. At today’s prices the value is doubled and payback halved. • ETV marketing value Comm states, “we present ETV performance data at every sales call, and we direct potential customers to EPA’s website so they can see for themselves the detailed verification reports. “ • Comm has installed 9 units since verification; estimated value of recovered gas is $6.570 M. • Comm, “We hope to install 1000 units in the US and overseas in the next 2-3 years.”