Making Calculus Come Alive using Dynamic Visualization
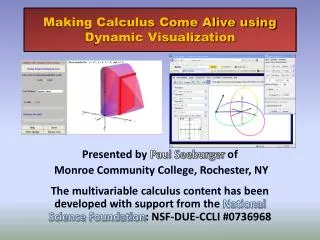
Making Calculus Come Alive using Dynamic Visualization. Presented by Paul Seeburger of Monroe Community College, Rochester, NY The multivariable calculus content has been developed with support from the National Science Foundation : NSF-DUE-CCLI #0736968.

Making Calculus Come Alive using Dynamic Visualization
E N D
Presentation Transcript
Making Calculus Come Alive using Dynamic Visualization Presented by Paul Seeburger of Monroe Community College, Rochester, NY The multivariable calculus content has been developed with support from the National Science Foundation: NSF-DUE-CCLI #0736968
Applets Available on my Website include: • Calculus Grapher(a 2D grapher with Calculus visualizations built in) • Riemann Sum Applet • Slope Field grapherfor visually verifying general solutions to separable differential equations. • Volumes of Revolutionand Volumes of a Common Cross-section visualizations • CalcPlot3D, an NSF supported applet to explore multivariable calculus.
Why use Visualization in Calculus? • Calculus is the mathematics of change. Limits are defined in terms of change, Derivatives represent rates of change, and Definite Integrals represent total change in an antiderivative function. To see calculus clearly, we need to see motion and change occuring.
Why use Visualization in Calculus? • Calculus is the mathematics of change. Limits are defined in terms of change, Derivatives represent rates of change, and Definite Integrals represent total change in an antiderivative function. To see calculus clearly, we need to see motion and change occuring. • Visualization helps make the geometric and motion-related connections become clear and much easier to remember.
Why use Visualization in Calculus? • Calculus is the mathematics of change. Limits are defined in terms of change, Derivatives represent rates of change, and Definite Integrals represent total change in an antiderivative function. To see calculus clearly, we need to see motion and change occuring. • Visualization helps make the geometric and motion-related connections become clear and much easier to remember. • When students “play” with the concepts, they will remember them better.
Why use Visualization in Calculus? • Calculus is the mathematics of change. Limits are defined in terms of change, Derivatives represent rates of change, and Definite Integrals represent total change in an antiderivative function. To see calculus clearly, we need to see motion and change occuring. • Visualization helps make the geometric and motion-related connections become clear and much easier to remember. • When students “play” with the concepts, they will remember them better. • Using visualizations during a lecture helps not only to develop geometric understanding, but also varies the format of the lecture enough to maintain student attention and involvement in the lecture.
Why use Visualization in Calculus? • Calculus is the mathematics of change. Limits are defined in terms of change, Derivatives represent rates of change, and Definite Integrals represent total change in an antiderivative function. To see calculus clearly, we need to see motion and change occuring. • Visualization helps make the geometric and motion-related connections become clear and much easier to remember. • When students “play” with the concepts, they will remember them better. • Using visualizations during a lecture helps not only to develop geometric understanding, but also varies the format of the lecture enough to maintain student attention and involvement in the lecture. • Visualizations can help students to become engaged in the concepts and begin asking “what if…” questions.
Ways to use of these applets: • Instructors can use them to visually demonstrate concepts and verify results during lectures. Also “What if…?” scenarios can be explored.
Ways to use of these applets: • Instructors can use them to visually demonstrate concepts and verify results during lectures. Also “What if…?” scenarios can be explored. • Students can use them to explore the concepts visually outside of class, either using a guided activity or on their own.
Ways to use of these applets: • Instructors can use them to visually demonstrate concepts and verify results during lectures. Also “What if…?” scenarios can be explored. • Students can use them to explore the concepts visually outside of class, either using a guided activity or on their own. • Instructors can use some of the applets (Calculus Grapher, Slopefield, and CalcPlot3D) to create graphs for visual aids (color overheads), worksheets, notes/handouts, or tests. 2D and 3D Graphs and slopefields can be copied from the applets and pasted into a word processor like Microsoft Word.
Ways to use of these applets: • Instructors can use them to visually demonstrate concepts and verify results during lectures. Also “What if…?” scenarios can be explored. • Students can use them to explore the concepts visually outside of class, either using a guided activity or on their own. • Instructors can use some of the applets (Calculus Grapher, Slopefield, and CalcPlot3D) to create graphs for visual aids (color overheads), worksheets, notes/handouts, or tests. 2D and 3D Graphs and slopefields can be copied from the applets and pasted into a word processor like Microsoft Word. • For multivariable calculus, Instructorscanuse CalcPlot3D to create lecture demonstrations containing particular functions they specify and/or guided explorations for their own students using a scripting feature that is being integrated with this applet.
Ways to use of these applets: • Instructors can use them to visually demonstrate concepts and verify results during lectures. Also “What if…?” scenarios can be explored. • Students can use them to explore the concepts visually outside of class, either using a guided activity or on their own. • Instructors can use some of the applets (Calculus Grapher, Slopefield, and CalcPlot3D) to create graphs for visual aids (color overheads), worksheets, notes/handouts, or tests. 2D and 3D Graphs and slopefields can be copied from the applets and pasted into a word processor like Microsoft Word. • For multivariable calculus, Instructorscanuse CalcPlot3D to create lecture demonstrations containing particular functions they specify and/or guided explorations for their own students using a scripting feature that is being integrated with this applet. Look for my 2-hour workshop on using CalcPlot3D in teaching multivariable calculus, as well as creating these scripts at AMATYC 2011 in Austin!
Contact Info: Paul Seeburger, Associate Professor of Mathematics at Monroe Community College, Rochester, NY Email: pseeburger@monroecc.edu Main Webpage: www.monroecc.edu/wusers/pseeburger/ NSF Multivariable Calculus Project Website: http://web.monroecc.edu/calcNSF/