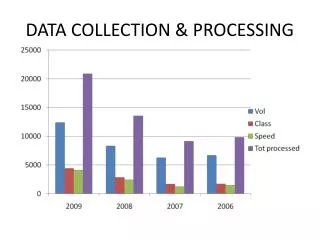
Data collection, data processing and scaling
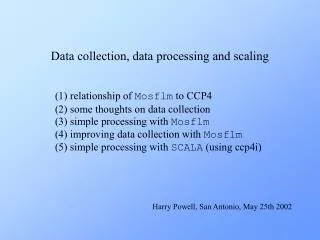
Data collection, data processing and scaling. (1) relationship of Mosflm to CCP4 (2) some thoughts on data collection (3) simple processing with Mosflm (4) improving data collection with Mosflm (5) simple processing with SCALA (using ccp4i). Harry Powell, San Antonio, May 25th 2002.

Data collection, data processing and scaling
E N D
Presentation Transcript
Data collection, data processing and scaling (1) relationship of Mosflm to CCP4 (2) some thoughts on data collection (3) simple processing with Mosflm (4) improving data collection with Mosflm (5) simple processing with SCALA (using ccp4i) Harry Powell, San Antonio, May 25th 2002
* Number of Datasets = 1 * Dataset ID, project/crystal name, dataset name, cell dimensions, wavelength: 1 lys_fine / 02_05_02:13:53:50 78.1485 78.1485 37.0149 90.0000 90.0000 90.0000 1.54180 * Number of Columns = 16 * Number of Reflections = 13368 * Missing value set to NaN in input mtz file * Number of Batches = 50 * HISTORY for current MTZ file : From MOSFLM run on 2/ 5/02 <snip> * Resolution Range : 0.00089 0.17159 ( 33.520 - 2.414 A ) * There is no sort order recorded in the MTZ header * Space group = P43212 (number 96)
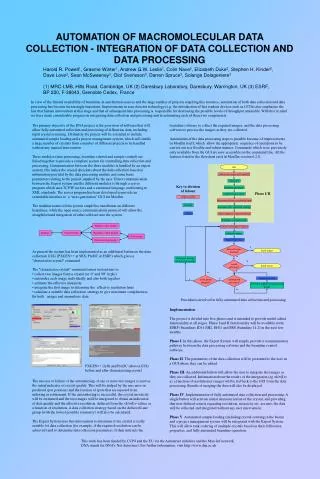
The X-ray Experiment crystal Mosflm X-rays images SCALA integrate scale phase
Optimization of Data Collection • Pre-process at least one image (preferably two at 90º to each other) to obtain: • Cell parameters, crystal orientation and putative Laue group • Estimate of mosaicity • Effective resolution limit • Crystal to detector distance • Exposure time • Strategy for data collection Remember! This is the last experimental stage - if you collect bad data now you are stuck with it. No data processing program can rescue the irredeemable!
What is needed prior to running Mosflm? • X-ray images • Experimental details (e.g. detector type, direct beam position, wavelength, etc) • The program itself and a computer to run it on!
[localhost:~/test/muldlx1] harry% ls *mar2000 muldlx1_301.mar2000 muldlx1_307.mar2000 muldlx1_313.mar2000 muldlx1_319.mar2000 muldlx1_302.mar2000 muldlx1_308.mar2000 muldlx1_314.mar2000 muldlx1_320.mar2000 muldlx1_303.mar2000 muldlx1_309.mar2000 muldlx1_315.mar2000 muldlx1_321.mar2000 muldlx1_304.mar2000 muldlx1_310.mar2000 muldlx1_316.mar2000 muldlx1_322.mar2000 muldlx1_305.mar2000 muldlx1_311.mar2000 muldlx1_317.mar2000 muldlx1_306.mar2000 muldlx1_312.mar2000 muldlx1_318.mar2000 [localhost:~/test/muldlx1] harry% ipmosflm ************ Version 6.2.1 for Image plate and CCD data 23 April 2002 *********** A.G.W. Leslie, MRC Laboratory Of Molecular Biology, HILLS ROAD, CAMBRIDGE CB2 2QH, UK E-mail andrew@mrc-lmb.cam.ac.uk New auto-indexing using DPS due to Ingo Steller Robert Bolotovsky and Michael Rossmann (1998) J. Appl. Cryst. 30, 1036-1040 Original auto-indexing using REFIX due to Wolfgang Kabsch (Kabsch,W. (1993), J.Appl.Cryst. 24,795-800.) X-windows interface using xdl_view due to John Campbell (Daresbury Laboratory, UK.) (Campbell,J.W. (1995) J. Appl. Cryst. 28, 236-242. MOSFLM => image muldlx1_301.mar2000 MOSFLM => go (Q)QOPEN: file opened on unit 1 Status: READONLY <B><FONT COLOR="#FF0000"><!--SUMMARY_BEGIN--> Logical Name: muldlx1_301.mar2000 Filename: muldlx1_301.mar2000 <!--SUMMARY_END--></FONT></B> Crystal to detector distance of 250.00mm taken from image header Wavelength of 1.54180A taken from image header
Crystal to detector distance of 250.00mm taken from image header Wavelength of 1.54180A taken from image header Pixel size of 0.1500mm taken from image header. Start and end phi values for image 1 from image header are 279.00 and 280.00 degrees. image FILENAME: muldlx1_301.mar2000 (Q)QOPEN: file opened on unit 1 Status: READONLY <B><FONT COLOR="#FF0000"><!--SUMMARY_BEGIN--> Logical Name: muldlx1_301.mar2000 Filename: muldlx1_301.mar2000 <!--SUMMARY_END--></FONT></B> The red circle denotes the region behind the backstop shadow (Use BACKSTOP keyword to set this.)
Running the STRATEGY option • In the GUI, click on the STRATEGY button • On the command-line, type STRATEGY. • In either case, determining a suitable strategy for data collection once you have a cell, orientation and crystal symmetry is straightforward. • Then run TESTGEN to check for overlaps
Checking the output (1) • There are two useful log files; • SUMMARY; this is of most use when viewed with the CCP4 graph viewer LOGGRAPH, as it contains graphs of parameters which have varied through the data processing. • mosflm.lp; this can be very large, and contains a complete record of the experiment.
Checking the output (2) • If everything has gone right so far; • check the MTZ file; is it as you’d expect?
Command-line processing Most commands in the GUI are available from the command-line; e.g. for the test images, the following could be done: # detector mar ! not necessary here! template muldlx1_###.pck beam 149.79 150.87 autoindex dps image 301 mosaic estimate go postref segment 1 process 301 303 go postref nosegment fix all process 301 322 go exit
Scaling with SCALA in ccp4i • Scaling and merging the data is the next step following integration. It is important because: • it attempts to put all observations on a common scale • it provides the main diagnostics of data quality and whether the data collection is satisfactory • Because of this diagnostic role, it is important that data are scaled as soon as possible after collection, or during collection, preferably while the crystal is still on the camera.
Checking the output of SCALA • Check these files/plots: • ROGUES • Normal probability plot(s) • Surface plot • SCALA log file • loggraph output