Download
1 / 46
460 likes | 620 Vues
Webinar: Trading Currency Futures (Part 2). Shaun van den Berg Head of Client Education Wednesday, 28 th August 2013 13h00 until 14h00. Agenda. Quick recap: Click here for recording What are Currency Futures? Advantages Risks Trading Plan What is the Trend?

E N D
Webinar: Trading Currency Futures (Part 2) Shaun van den Berg Head of Client Education Wednesday, 28th August 2013 13h00 until 14h00
Agenda • Quick recap: • Click here for recording • What are Currency Futures? • Advantages • Risks • Trading Plan • What is the Trend? • Where is your entry/ stops? • Where is your take profit? • Summary & Conclusion
Introduction • Foreign exchange market operates 24-hours a day. • Markets open in the Far East • Tokyo winds down - European markets open • Followed by the US & as the US reaches its close • The Far Eastern markets open their doors once again. • Turnover up from $5-Billion (1977) to $3.2-Trillion a day! • South African currency futures market began in 2007 • 2007: Total value traded = R1.5-billion. • 2013: R100-billion traded
Quick Recap: What are Currency Futures? • Standardised contracts • Expire on the third Monday of March, June, September & December. • Contract size • 1 contract exposes you to 1 000 of the foreign underlying currency • e.g. US$1000 or €1000 or ₤1000 • Price Movement 1 c = R10 Profit or Loss per contract • Cash Settled on expiry in Rands. • Contracts quoted in SA Rand to 4-decimal places • No physical delivery of foreign currency. • Gearing/Leverage can be as high as 20-times but we limit it to 10-times. • Contracts cannot be rolled – Closed out. • Initial margin is 2 times the JSE margin. • 50% of this amount will go to initial margin • 50% will go to retained margin - Used as a buffer for MTM movements. • Mark-to-Market (MTM) – Daily revaluation of each open position at the close of trade. • Variation margin – Unrealised profits & losses are processed into the client’s cash account by the exchange through the MTM process.
Quick Recap: Who trades Currency Futures? • The fund manager looking at hedging his offshore exposure • Sells Dollar contracts to hedge against strengthening USDZAR. • A farmer / manufacturer importing machinery from France • Buys Euro contracts to hedge against weakening EURZAR. • An investor with ordinary shares in Sasol • Buy Dollar contracts to protect his Sasol holdings from Rand strength. • A speculator who views Pound as overvalued relative to the Rand • Sells GBPZAR contracts • Benefit from currency exchange should this move take place.
Quick Recap: Currency pairs traded on YieldX • Dollar/Rand • Euro/Rand • Pound/Rand • Aussie Dollar/Rand • Yen/Rand • Canadian Dollar/Rand • Swiss Franc/Rand
Quick Recap: Example of a Speculative Trade • Normal future trade – Dollar Bear (Buy Rand/ Sell Dollar) • Client A feels current economic environment - Lot of positive sentiment & he feels that we will start seeing a more risk-on environment coming our way • Risk-on environment - Investors shy away from safe haven assets (USD, JPY & CHF) • Money flow should then favour risky assets. • Rand is a regarded as a risk asset being an emerging market currency • Client A feels that US Dollar is overvalued (too strong) & should depreciate. • On day 1 the spot rate is trading at 10.2000 • The future is trading at 10.3234. • Client A sells 100 Sep 13 USDZAR contracts @ 10.3234 • Margin per contract is R900 per contract = 100 x R900 = R90 000 • Brokerage is R18.00 per contract = 100 X R18 = R1800 to open the position • Remember, brokerage paid to close the position = 100 X R18 = R1800 • Client A pays to PSG R91 800 (R90 000 +R 1 800) • Initial margin earns interest on deposit at SAFEX rates.
Quick Recap: Example of a Speculative Trade • On day 4 the spot rate is trading at 10.00 • The future is trading at 10.1234 • Client A buys the 100 Sep13 USDZAR contracts back at 10.1234 • Remember, Client A sold 100 Sep13 USDZAR contracts @ 10.3234 • Gross Profit = 20c x 100 x R10 = R20 000 • Total Brokerage = R3 600 (R1 800 X 2) • Net Profit = R16 400 • The initial capital outlay of R90 000 has returned a net profit of R16 400 • A return of 18.22% during the period in which the Rand only weakened by 2.4% • Day trade (i.e. open & close on same day) - Brokerage is only paid on the one leg. • Total brokerage would then be R 1800 (i.e. R18 x 100)
Quick Recap: What are the Benefits of Currency Futures? • Tight spreads & low trading costs - Allow traders to enter & exit positions, knowing that profits are not paid away each time there is a trade on the account. • Cheap - Trading Currency Futures costs R18.00 (including VAT) per contract. • Transparent Pricing - Buy & sell prices are posted in real-time onto the central market by the relevant market makers. • Geared product - Do not have to deposit cash to cover the full value of the position. • Favourable Rates – Currency Futures allow individual investors to take a view on the movement of the currency futures rate & provide them with access to favourable rates usually reserved for larger corporate clients. • Hedging - Importers & exporters can dynamically hedge their currency risk far more efficiently using futures due to the ease of entering & exiting futures positions & the low cost per trade. • Market liquidity - Dedicated market makers ensure market liquidity & ensures that currency traders can open & close currency exchange contracts with multiple counterparties. • M-T-M - Daily mark-to-market process allows clients ability to track profits or loss • Adjust portfolio accordingly. • Settlement - Once the position has been closed out settlement occurs in Rand. • Daily Statements - Receive daily statements showing your margin & cash movement
Quick Recap: Risks to trading Currency Futures? • Currency futures are geared instruments. • You are able to makelarge profits from small initial layouts of capital. • Should the trade move against you, you could incur large losses. • There is a risk that you may lose more money than you initially invested. • Trading Currency Futures require: • A high appetite for risk • Time to watch the markets • Expert knowledge of the currency markets & associated trading process. • Not for everyone - You should carefully consider whether such trading is suitable for you in light of your circumstances & financial resources.
Quick Recap: Risks to trading Currency Futures? • Each currency future trade is unique & comes with its own associated risks: • Volatility • Exchange rate risk • Credit risk • Monetary risk • Interest rate risk • Possibility of government intervention in the financial markets. • Experienced traders learn to evaluate these variables. • Most important thing to remember: • Not every trade will be a successful trade/ profitable • With every trade you should also have a target price/profit target in mind. • Be strict & diligent. • Do not trade on emotion; trade on fundamentals • A strategy & logic with some common sense. • Tempting to ride a trade into profit & stay in the trade for larger gains. • This can go wrong & you may well ride the trade all the way back into losses.
How Currency Futures work? • To open a position, an investor must deposit initial margin with the JSE. • Initial margin is 2 times the JSE margin. 50% of this amount will go to initial margin & the other 50% will go to retained margin, used as a buffer for MTM movements. • 16SEP13 ZAUS = R450 x initial margin & R450 x retained margin = R900 • 16SEP13 ZAEU = R500 x initial margin & R500 x retained margin = R1000 • Mark-to-Market (MTM) – Daily revaluation of each open position by JSE at the close. • Variation margin – Unrealised profits & losses are processed daily into the client’s cash account by the exchange through the MTM process. • Leverage (or “gearing”) simply means to trade with margin. • The value of currencies transactions engaged is higher than the amount a trader or investor has on margin. • Double-edged sword - Large gains if currencies move as anticipated, but can cause large losses if the exchange rate moves in the opposite direction. • The concept of being “wiped out” is not just a theoretical possibility, but a real one.
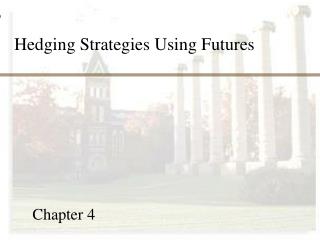
Order Book / PSG Online Trading Platform All the sellers in the market (Offers) Initial Margin Required = R900 All the buyers in the market (Bids)
Order Book / PSG Online Trading Platform Currency clients looking to buy 500 contracts at 10.2897. Order will only execute when the Offer becomes 10.2897 Large market maker in the market, normally a bank Direction Buy = ZAR strength / USD weakness Sell – ZAR weakness / USD strength Price in Rands e.g. 10.29 Contracts 1000 x USD
Trading Plan • What is the trend? • Fundamental Analysis • Technical Analysis • Where is your stop loss level & entry level? • Where is your take profit or exit level • What is the trend? • Trend analysis - Used to predict the movement of market. • Decide whether the market in bullish or bearish trend • Helps you decide whether to buy or sell
Fundamental Analysis • Fundamental analysts follow the consistent releases of macro economic data of the countries whose currencies they trade to determine trend & direction. • Fundamentals affects sentiment – Flow of money. • Helps you understand how money moves from: • Developed markets to emerging markets • Emerging markets to developed markets • Fixed income securities to equities • Equities to fixed income securities
Risk-on sentiment • Investors are bullish in their view - Like to invest in riskier assets • Emerging market assets - e.g. South African equities & Rand • Shy away from bonds & equities in the developed market • Buy securities in the undeveloped markets (i.e. emerging markets) - Offer a higher risk/ higher reward ratio. • South Africa is a favourite emerging market destination. • Investors wanting to buy South African securities will need to sell their local currency & buy Rand in order to trade on JSE & SAFEX - Leads to Rand strength
Risk-off sentiment • Investors are bearish in their view / Shy away from riskier assets. • Investors sell off emerging market securities i.e. South Africa • Investors will sell Rand-based securities • Get their foreign currency back • Taken out of South Africa • Leads to Rand weakness • We see investors running to “safe haven” assets • They feel their money is most likely to be safe & retain its value • US 10 Treasury Government Bonds • Swiss Franc • Japanese Yen
Important Economic Data • Employment data • Strong employment data = Risk-on / Strengthening Rand (Buy) • Weak employment data = Risk-off / Weakening Rand (Sell) • Consumer confidence data • Strong consumer data = Risk-on / Strengthening Rand (Buy) • Weak consumer data = Risk-off / Weakening Rand (Sell) • Retail Sales • Strong retail sales = Risk-on = Strengthening Rand (Buy) • Weak retail sales = Risk off= Weakening Rand (Sell) • Manufacturing / Production data • Strong manufacturing data = Risk-on / Strengthening Rand (Buy) • Weak manufacturing data = Risk-off / Weakening Rand (Sell)
Dollar Index • Measures the performance of the US Dollar against a weighted basket of other currencies. • Data showing that the Dollar index is trading up: • Signals investor appetite for the Dollar • May be as a result of investors buying Dollar-based securities • Seeking a safe haven = Risk-off environment/ Risk aversion • Leads to a weakening Rand. • If the Dollar index is trading lower: • Signals investor risk appetite for the emerging markets currencies • Investors sell Dollar-based securities • Prefer emerging markets - Risk-on environment • Leads to a strengthening Rand.
Dollar Index Source: http://www.fxstreet.com/rates-charts/usdollar-index/
Important Economic Data • US 10-Year Treasury Government Bond • If yields decrease and trade down it signals investors are buying the bond in attempt to run for safety I.e. risk off environment • This normally equates to a weakening Rand • R157 South African benchmark bond • In a risk on environment, investors may look to buy South African bonds • Offer higher yields compared to bonds in the developed countries. • When investors buy the R157 - Yield starts to decrease. • Decreasing yield may also go hand-in-hand with a strengthening Rand • Investors sell their local currencies & buy the Rand denominated bond. • JSE Top 40 Index • Risk-on sentiment continues – Investors find SA equities appealing. • Buying Rand-based South African equities results in the Top 40 Index strengthening - Rand strength.
Important Economic Data • Gross Domestic Product (GDP) • Positive GDP signals that economy is growing • Can cause investors to want to take risk-on • They start to feel bullish about growth prospects • Watch GDP from the Euro zone (especially German) • Watch GDP data from USA, India & China • Consumer Price Inflation (CPI) • Increasing or high inflation is negative for investments • Eats away at investors profits • Investors prefer lower inflation zones. • Governments increase interest rates in an effort to reduce inflation in the economy • Increased interest rates in South Africa are Rand positive
Important Economic Data • Interest rates cuts / interest rate hikes • Currencies follow & seek out higher interest rate zones / countries • An interest rate cut in South Africa is Rand negative • An interest rate hike in South Africa is Rand positive as investors will seek to buy South African bonds that offer higher yields compared to those in developed countries • Interest rates normally lowered to free up money & boost economic growth. • Lowering interest rates in South Africa would normally be Rand negative • South African interest rates are currently at 5.00%, the lowest they have been in over 30-years. • UK interest rates = 0.5% / EU interest rates = 0.75% • South Africa stills offers attractive returns to investors.
Important Commodities • Gold • Gold for a long time has been seen as a safe haven asset • Place to protect your money / Uncertainty – Risk-off environment. • An increase in the gold price may be fuelled by investors buying gold as a safe haven in a risk-off environment. • An increasing gold price may point towards a weakening Rand • Copper • Copper is associated with industry & production • Strong manufacturing/production data and GDP data generally points towards a growing economy. • A growing economy needs copper and this will raise the price of copper, thus bullish copper prices can signal a risk on environment, which may fuel investor appetite for risk assets and the Rand.
Introduction to Exchange Traded Products Overview to Exchange Traded Products What are Exchange Traded Products? ETP Investment Options Advantages & Disadvantages
Trend Analysis: Technical Analysis • Technical analysts evaluate market prices based on historical price patterns. • Suggested technical indicators to use to predict market trends: • MACD • Overbought/Oversold indicator
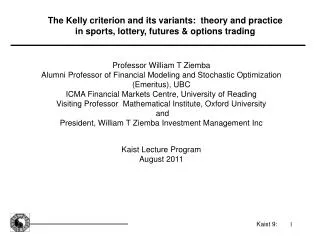
MACD Indicator • MACD is an acronym for Moving Average Convergence Divergence. • Used to identify moving averages that are indicating a new trend • Bullish or bearish. • The two lines that are drawn are NOT moving averages of the price. • Moving averages of the DIFFERENCE between two moving averages. • Two moving averages are the “slow” & the “fast” moving average • As the moving averages get closer to each other we get convergence because the faster moving average is "converging" or getting closer to the slower moving average. • As the moving averages get further apart we get divergence.
MACD Indicator • As the slow moving average & the fast moving average approach each other it signals a potential change in trend approaching. • Trend changes when the two averages cross each other. • If the slow average is above the fast average - Bearish trend. • If the slow average is below the fast average - Bullish trend. • If the trade price if above the MACD - This is a bullish trend. • If the trade price if below the MACD - This is a bearish trend.
MACD Chart Trading above the moving average = Bullish Trend Trading below the moving average = Bearish Trend Fast moving average is above slow moving average = Bullish Trend Slow moving average is above the fast moving average = Bearish Trend
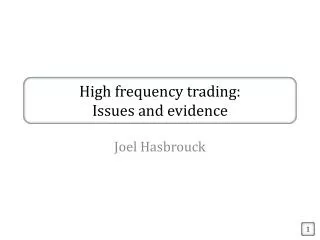
Overbought / Oversold Indicator • Overbought / oversold (OB/OS) indicator - Determine whether market is due for a correction • An asset that has experienced a sharp upward movement over a very short period of time is often deemed to be overbought. • The opposite occurs when there has been a sharp downward movement over a very short period of time is often deemed to be oversold. • Determining the degree in which an asset is overbought is very subjective & can differ between investors. • Investors should use indicators such as the relative strength index (RSI) or the Stochastic oscillator to identify if the security is becoming overbought.
Overbought / Oversold Chart Market turned bullish & traded above the MA after the market was oversold Market is very oversold, expect a correction & bullish trend to develop Zero line indicates market is neutral
Resistance & Support Levels • Resistance Levels • The price at which a currency or market can trade, but not trade above, for a certain period of time is referred to as "resistance level“ • Support Levels • The price at which a currency or market can trade, but not trade below, for a certain period of time is referred to as “support level“ • Level 3 of the support/resistance is stronger that level 2 which is in turn stronger than level 1 • A currency pair may pierce level 1 of the resistance & trade up towards to level 3 of the resistance but may find it difficult to pierce level 3. • Consequently we may find the pair trading back down after that towards the support levels • PSG Rand Report – All relevant resistance & support levels for each currency is indicated
Entry Levels & Stop Loss Levels • Putting your trade plan together • Decide on the trend & the direction of the market (i.e. Bullish/Bearish) • You need to decide on your entry level & stop loss • Bullish trend - Buy in dips towards the support levels • Bearish trend - Sell in spikes towards the resistance levels. • Stop Loss is a level where you will decide to get out of the trade should you call the direction wrong. • Breaking relative support or resistance levels convincingly could indicate a change in direction - You should stop out • You need to decide how far you can comfortably ride the trade in losses before closing. • This will depend on your personal risk profile & your margin. • PSG Rand Report will also guide you on relative stop loss levels.
Take Profit or Exit Levels • After you have decided on your entry & stop loss levels • Your next need to decide on your take profit or profit target. • On a long(Buy) trade in a bullish market • Logical target for your trade would be a strong resistance level. • You want to get out of the trade before the market reaches the resistance levels & turns down & starts to trade in a bearish pattern. • That may lead to you riding your trade into profit & back into losses. • On a short(Sell) trade in a bearish market • Logical target for your trade would be a strong support level. • Profit targets are also linked to investors risk profile & personality types. • PSG Rand Report will also guide on profit target levels
Getting Started • Understand the product: What are Currency Futures? • Contract details: Margin, etc. • Technical analysis: Wen Professional Plus (FREE) • Technical Indicators / Trend lines • Paper trade (Excell spread sheet) • Buying or Selling? Spot & Future Price? Margin? Brokerage? • Gain confidence (Understand margin movement / MTM) • Trading Plan – Entry, stops & profit levels • Start trading! • Start small – 1 Dollar contract = R900 margin • Gain confidence (Understand margin movement / MTM)
Summary • Standardised contracts / Regulated • Trade 1 000 of the foreign underlying currency • Price Movement 1 c = R10 Profit or Loss per contract • Cash Settled on expiry in Rands/ Closed out. • Contracts quoted in SA Rand to 4-decimal places • No physical delivery of foreign currency. • Initial margin is 2 times the JSE margin. • Gearing/Leverage = 10-times. • Mark-to-Market (MTM) – Daily revaluation of open positions. • Variation margin – Unrealised profits & losses processed / Top-up. • Trading Plan: • What is the Trend? • Where is your entry/ stops? • Where is your take profit?
Conclusion • Review the information of the PSG Online website • Review this PowerPoint presentation (Link emailed soon!) • Review the webinarrecording • Email any questions (Shaunvdb@psg.co.za) • Post to Facebook: https://www.facebook.com/PSG.Online • Follow us on Twitter: https://twitter.com/PSGOnline • Open a SSF/ Currency Futures account today! • Good Luck • Happy Trading!
Contact Us Thank You Shaun van den Berg Shaunvdb@psg.co.za (011) 996 5254
Disclaimer This publication has been issued by PSG Online. It is confidential and issued for the information of clients only. It shall not be reproduced in whole or in part without our permission. The information contained herein has been obtained from sources which and persons whom we believe to be reliable but is not guaranteed for accuracy, completeness or otherwise. Opinions and estimates constitute our judgement as of the date of this material and are subject to change without notice. Past performance is not indicative of future results. This report is provided for informational purposes only. No information contained herein, no opinion expressed and no recommendation made constitutes a representation by us or a solicitation for the purchase of any of the securities mentioned herein and we have no responsibility whatsoever arising here from or in consequence hereof. Securities, financial instruments or strategies mention herein may not be suitable for all investors and investors must make their own investment decisions using their own independent advisers as they believe necessary and based upon their specific financial situations and investment objectives. The employees of PSG Online may from time to time own securities mentioned herein. Analyst Certification The research analyst who prepared this report certifies that the view expressed herein accurately reflect the research analyst’s personal views about the subject security and issuer and that no part of his compensation was, is or will be directly or indirectly related to specific recommendations or views contained in this report.