Download
1 / 14
140 likes | 236 Vues
Herbicides in Metro Atlanta Streams and Rivers. Data Analysis Cristal Moon. Rivers. Suwanee Creek Nickajack Creek Chattahoochee River. Questions. Do herbicide levels have yearly trends? Are they related to other factors in surface water?. Variability of two Pesticides in Chattahoochee.

E N D
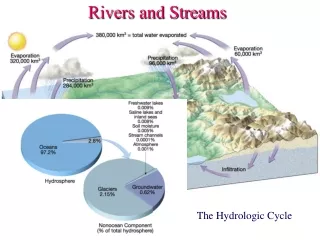
Herbicides in Metro Atlanta Streams and Rivers Data Analysis Cristal Moon
Rivers Suwanee Creek Nickajack Creek Chattahoochee River
Questions • Do herbicide levels have yearly trends? • Are they related to other factors in surface water?
Least Squares Regression Error variance=0.0089 Correlation Coefficient= 0.1681 P-value=0.1016 Error variance=0.3095 Correlation Coefficient= 0.1375 P-value=0.1814 + is levels, green line is regression, red bars are 95% confidence levels
Normal? Chi2=4,337,300 Chi2inv=118.7516 Chi2>Chi2inv, therefore distribution is not normal Chi2= 527.3569, Chi2inv=118.7516 Chi2>Chi2inv, therefore distribution is not normal
Discharge vs. Herbicides Correlation Coefficient: -0.0133 P-value= 0.8974 Correlation Coefficient: 0.0374 P-value=0.7174
Specific Conductance vs. Herbicides Correlation Coefficient= -0.1757 P-value= 0.0868 Correlation Coefficient= -0.2161 P-value= 0.0344
pH Correlation Coefficient= 0.0063 P-value= 0.9515 Correlation Coefficient=-0.0919 P-value= 0.3732
Principle Component Regression Green is Least-Squares, Blue is Reduced Major Axis, Black is PCR
LSSA Significant frequencies (in Hz) at 0.97765 Corresponding powers: 8.7976 Significant frequencies (in Hz) at 0.97765 Corresponding powers: 16.0276
Conclusions • Annual increase in herbicides early in year • Linear increase over time • Levels not related to pH or discharge • Specific Conductance somewhat correlated