Download
1 / 47
470 likes | 605 Vues
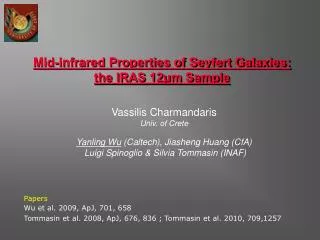
Mid-infrared Properties of Seyfert Galaxies: the IRAS 12μm Sample. Vassilis Charmandaris Univ. of Crete Yanling Wu (Caltech), Jiasheng Huang (CfA) Luigi Spinoglio & Silvia Tommasin (INAF). Papers Wu et al. 2009, ApJ, 701, 658

E N D
Mid-infrared Properties of Seyfert Galaxies: the IRAS 12μm Sample Vassilis Charmandaris Univ. of Crete Yanling Wu (Caltech), Jiasheng Huang (CfA) Luigi Spinoglio & Silvia Tommasin (INAF) Papers Wu et al. 2009, ApJ, 701, 658 Tommasin et al. 2008, ApJ, 676, 836 ; Tommasin et al. 2010, 709,1257
Outline of the talk • Some motivation behind studying AGN in the infrared • The 12μm Seyfert Sample • Focus on low resolution mid-IR spectroscopy with Spitzer • Global Infrared SED properties • The 20μm “peakers” … • Polycyclic Aromatic Emission (PAH) in Seyferts • Absorption and H-column densities • Conclusions
Why measure SF and accretion together? • On cosmic scale the evolution of SBMH appears tied to the evolution of SFR (Merloni et al. 2004) • Low-z SDSS emission-line AGN indicate the SMBH growth and bulge growth via SF are related (Heckman et al. 2004) • Locally it appears that SF and nuclear activity are linked: HII -> Seyfert 2 (ie Storchie-Bergmann et al. 2001) HII -> Seyfert 2 -> Seyfert 1 (ie. Hunt & Malkan 1999) • Using the infrared to study this issue offers a number of advantages the more important of which is…
… we can find more AGN (not only Compton thick) • For 66 IR bright (LIR >3x10⁹ Lsun) at distances less than 15 Mpc • There are 27% IR identified AGN - contrary to 11% in the optical (Goulding & Alexander 2009) • But see also Wild et al. 2010 (MNRAS in press @arXiv:1008.3160) IR & Optical IR only
Probing the dominant energy source of galaxies • Many methods developed to quantify the fraction of star formation or emission from an accretion disk (AGN) in galaxies. • (Mushotzsky @astro-ph/0405144) • The presence of an AGN can be detected most ambiguously via: • Hard X-rays (>10keV) • Multi frequency radio observations (thermal/synchrotron fraction) • Difficulties: • Very few hard X-ray photons • Problems of self absorption in the interpretation of radio • For practical reasons most work has been performed via: • Optical spectroscopy (i.e. Kim et al. 1998, Hao et al. 2005) • Near-IR spectroscopy (i.e. Veilleux et al. 1999) • Advantages of IR: • Most galaxies emit a larger fraction of their energy in the IR. • Less affected by extinction than optical/near-IR
IR diagnostics of AGN • IRAS Era: • using the differences in IRAS colors -warm/coldsources(i.e. de Grijp 1985) • Difficulty:Broadband colors only. • ISO Era: • Detect High Ionization lines(Genzel et al 1998, Sturm et al. 2002) • [NeV] at 14.3μm / 23.2μm (Ep~97eV) • [OIV] at 25.9μm (Ep~55eV) • Difficulty:the lines are faint • Detect changes in continuum / broad features • Presence of 7.7μm PAH(Lutz et al. 1999) • Relative strength of 7.7μm PAH with respect to the 5.5μm and 15μm continuum(Laurent et al. 2000) • Difficulties: • - The 7.7PAH is affected by the 9.7μm silicate feature • - The mid-IR continuum was not well defined with • ISO PHOT-S (~11.8μm) & ISOCAM/CVF (~16μm)
IR diagnostics of AGN (2) • Spitzer Era: On-going efforts • Large sample of galaxies, both in the local universe and at high-z • Detect ISO High Ionization lines(Armus et al 2007, Farrah et al. 2007, Veilleux et al. 2009) • [NeV] at 14.3μm / 23.2μm (Ep~97eV) • [OIV] at 25.9μm (Ep~55eV) • Extend to other Ionization lines(Dale et al. 2009 & Hao et al. 2009) • [SiII] at 34.8μm & [S III] at 33.8μm • [FeII] at 26.0μm • Detect changes in continuum / broad features • Presence of 6.2μm PAH(Desai et al. 2007) • Measurements of 9.7μm Si extinction(Spoon et al. 2007) • Combine with L,M, band slope • PAH at 3.3μm (Imanishi et al. 2006) • Slope at 2-4μm(Nardini et al. 2008)
F12μm ~ 0.2 Fbol for all types of AGN (Spinoglio et al. 1995) Better sample definition for a statistical study Why Select Seyferts at 12μm?
Le Floc’h et al. 2005 All L(IR)<1011 Lsun 1011 Lsun<L(IR)<1012 Lsun L(IR)>1012 Lsun LIRGs dominate the IR/SFR at z~1 Most near-by 12μm selected Seyferts are LIRGs Also CXR background/number counts due to (obscured) Seyferts at z~0.7 (Hasinger et al. 2005; Worsley et al. 2005; Gilly et al. 2007)
PAH Normal Modes (reminder) • 10-20% of the total IR luminosity of a galaxy • Tens - hundreds of C atoms • Bending, stretching modes 3.3,6.2,7.7,8.6,11.2,12.7 m • PAH ratios ionized or neutral, sizes, radiation field, etc. Leger & Puget (1984) Sellgren (1984) Desert, et al. (1990) Draine & Li, (2001) Peeters, et al. (2004)
PAHs & Galaxy Energy Balance Helou et al., ApJ, 2001
Dale et al., 2001 Chary & Elbaz, 2001 PAHs and Extragalactic Templates • Sources of PAH templates used to date: • Theoretical/Lab PAH band models. • Few bright ISO galaxies (e.g. Arp220) • Average ISO Key Project “normal” galaxy spectrum.
Papovich et al., 2004 Lagache et al., 2004 Implications to the IR Number Counts At z~1 the 24μm observed counts sample the 10-14μm rest frame It is crucial to understand the PAH emission in various environments
IRAS 12>0.22 Jy, complete down to 0.3 Jy (893 sources - Rush et al. 1993) Average redshift ~0.013 116 Seyferts: 53 Sy 1s, 63 Sy 2s 103 were observed with the Spitzer/IRS (47 Sy 1s, 56 Sy 2s) at low resolution (95 in high-resolution) Note: Since the Seyfert classification is done via optical spectroscopy this is not strictly an IR “flux limited” sample The 12μm IRAS Sample • Control Sample of star forming galaxies • 16 Starbursts “usual suspects” (Brandl et al. 2006) • 22 Star forming systems from SINGS (Smith et al. 2007)
Infrared Spectrograph (IRS) on Spitzer PI= Jim Houck, Cornell University Contractor= Ball Aerospace Key Features • Uses 128x128 Boeing Si:As and Si:Sb arrays • No moving parts • Two, R~600 echelle modules (1019.5, 19.337 m) • Two, R~80 longslit modules (5.314.5, 14.238 m) • Peak-up imaging (13-18.5 and 18.5-26 m) Acquisition of sources with poorly known positions and 0.5 500 mJy. Peak-up on the science target or a nearby offset star whose relative position is accurately known. • The IRS + Spitzer operates in staringor spectral mapping modes
IRS MIPS IRAC 10/00 Spitzer Instruments – BALL Oct. 2000 Price ~$30 million
The Spitzer/IRS 12μm Seyfert Sample Mostly near-by (z < 0.03) Mostly LIR~1011 Lsun
Observations • Complete IRS low-resolution spectra 5-38μm (R~ 68-128) (Wu et al. 2009) • Extraction over an aperture with size 20x15 arcsec to match all IRS slits • 5-15μm properties were examined using aperture 4 times smaller Still we are not really talking about “nuclear spectra” • High-resolution 10-35μm spectra also available (R~600) Tommasin et al . 2008 & 2010
Typical mid-IR Spectra Wu et al. 2009
Average mid-IR Spectra Wu et al. 2009
19 “20μm peakers” (15+4) 56 Sy 2s 47 Sy 1s Additional hot dust component @150K Possible emission from Si @18μm Average IR SEDs of all Seyferts Wu et al. 2009
Average IR SEDs of all Seyferts Sy 1 Sy 2 Slope α(15-30μm) Sy 1: -0.85+/-0.61 Sy 2: -1.53+/-0.84 No real diference 20μm peakers 20μm peakers 32% of all Sy 1 9% of all Sy 2 F25/F60 ~ 0.75 F25/F60 Sy 1: 0.3 Sy 2: 0.1 F20/F30 > 0.95
PAHs Properties (1) Wu et al. 2009 PAH 11.2μm EW decreases in both types as mid-IR fν slope increases No difference is seen between Sy 1s and Sy 2s(contrary to Clavel et al 2000)
PAHs Properties (2) PAH 11.2μm EW decreases in warmer sources (as in ULIRGs Desai et al 2007) No difference is seen in PAHs between Sy 1s and Sy 2s Average EW: Sy 1s = 0.21 +/- 0.22μm , Sy 2s =0.38 +/- 0.30μm
PAHs Properties (3) PAH @ 6.2μm C-C stretching mode / PAH @ 11.2μm C-H out of plane mode No difference in PAH flux ratios is seen between Seyferts and Starbursts Chemistry remains the same over the volume sampled (~500pc scales)
PAHs Properties (4) The 11.2μm PAH EW does show marginal decrease for L(IR) >1011 Lsun but nothing as dramatic as in local ULIRGs (Desai et al. 2007)
Comparison with local ULIRGs Based on 107 local ULIRGs (Armus et al. 2007, Desai et al. 2007) The PAHs of starburst galaxies (HII) with L(IR) >1012 Lsun do not scale
Comparison with local ULIRGs (2) 12μm Seyferts The PAH EW decreases with IR luminosity in ULIRGs (Desai et al. 2007) The 12μm Seyferts display more scatter
Silicate Absorption Despite the difference in the size of the emitting region most sources with strong silicate absorption (< -0.5) have high X-ray estimated H column densities NH>1023 cm-2. Most are Sy2s.
High resolution mid-IR spectroscopy Rich Spectrum - Fine structure ionic and molecular (Η2) lines. (Tommasin et al 2008)
Probe AGN activity with [NeV] & [OIV] AGN dominates Seyfert 1 Seyfert 2 Star formation dominates [NeV] @ 14.3μm & 24.3μm with IP 97.1eV / [NeII] @ 12.7μm with IP 21.5eV [OIV] @ 25.9μm with IP 54.9eV (Tommasin et al 2008 - only 29 Seyferts)
Estimate electron densities Seyfert 1 Seyfert 2 Electron densities (ne) of 50% of Sy2s are above 103.5 cm-3. Sy1s have lower ne. Most lie close to but above the low density limit (contrary to Duddik et al. 2007) > Supports presence of thin extended coronal region (Spinoglio & Malkan 1992)
What powers the 12μm Luminosity? AGN emission reveals its presence clearly at ~6μm (dust at ~800 K) Can it be seen and estimated at 12μm? At IRAS 12μm Seyferts contribute ~15% Lbol, compared to ~7% for starforming galaxies (Spinoglio et al. 1995)
The IRAS 12μm and PAH 11.2μm luminosities • In starbursts the 11.2μm PAH flux correlates with the IRAS 12μm continuum • In Seyferts there is an extra contribution due to the AGN warm dust emission • Can we quantify this in a statistical manner?
Fractional PAH power 6.2μm, 12.6μm => ~10% 7.7μm => ~30% 11.2μm, 17μm => ~15% (SINGS - Smith et al. 2007)
Let’s define as R the fraction of the mean 11.2μm PAH luminosity due to star formation (SF) to the 12μm luminosity R = < LPAH_SF / L12μm_SF > Assuming that for every Seyfert the starburst contribution at 12μm scales with the 11.2μm flux then the total 12μm luminosity is L12μm = LSF + LAGN = (LPAH / R) + LAGN Consequently the AGN contribution (“AGN fraction”) to the 12μm luminosity (L12μm) is: “AGN fraction” = (L12μm - LSF) / L12μm The 12μm “AGN fraction”
The 12μm “AGN” fraction (2): a sanity check Wu et al. 2009 In starbursts the IRAC 8μm flux is dominated by the 7.7μm PAH (Smith et al. 2007) Note that when the 7.7μm PAH contribution increases the AGN decreases as it should!
Conclusions • The mid-IR continuum of Sy 1 & Sy 2 are not statistically different (good result for IR modeling of sources) • A class of “20μm peakers” is detected mostly in Seyfert 1s • PAH strength does not depend on Seyfert type -> Suggests that we are optically thin at ~12μm to the bulk of the emitting volume. Inconsistent with continuous torus models • PAH EW decreases as the IR color becomes warmer • PAH EW tends to decrease with IR luminosity • Silicate absorption is stronger in Sy 2s than in Sy 1s and preferentially higher to high-luminosity systems. • High ionization fine structure lines are more visible in Sy 1s. • Electron densities higher in Sy 2s than in Sy 1s. To do… • Study in more detail the “20μm peakers” decomposing their SED to the various dust components
SED Decomposition of a Galaxy Credit: F. Galliano
Decomposition of the Infrared Spectrum • Core of the method Marshall et al. (2007) • Assume absorption cross sections from Li & Draine (2001) and an MRN grain-size distribution • Calculate the opacities of PAH, graphitic and smoothed astronomical silicate grains. • Each dust component has a quasi-fixed temperature i.e.. the fitting process is really an expansion into several temperature basis components. • The number of dust components is fixed for the sample so that all galaxies are fit in a uniform manner. • In addition to a ~3500 K stellar blackbody and PAH component, we find that we need ~3 additional continuum dust components with T~400, ~150, and ~30 K to accurately fit the entire sample. • An AGN manifests its presence with the requirement of an additional hot dust component T~800K (Laurent et al. 2000)
The case of Mrk1014: a ULIRG (F12μm=0.12Jy) T*~3300 K Tcold~38 K Twarm~121 K Thot~454 K τwarm~1.7 τice~0.3 Ldust~4.2x10¹² L Lcold/Ldust~0.57 Lwarm/Ldust~0.32 Lhot/Ldust~0.1 Mcold~1.5x10⁸ M Mwarm~ 2.6x10⁵ M Mhot~ 83 M
The case of NGC7714: a starburst T*~3100 K Tcold~30 K Twarm~85 K τwarm~0.6 Ldust~4.5x10¹⁰ L Lcold/Ldust~0.67 Lwarm/Ldust~0.33 LPAH/Ldust~0.05 Mcold~5.7x10⁶ M Mwarm~ 8.3x10³ M
The case of PG0804-761: a QSO/AGN T*~4500 K Tcold~43 K Twarm~215 K Thot~817 K τwarm~0.7 τhot~0.7 Ldust~8.4x10¹¹ L Lcold/Ldust~0.07 Lwarm/Ldust~0.61 Lhot/Ldust~0.48 Mcold~1.4x10⁶ M Mwarm~ 3.4x10³ M Mhot~ 30 M