Enhancing Understanding of Full-Text Usage: Insights from SFX Data at UT Libraries
This presentation from the ELUNA 2nd Annual Meeting discusses the MaxData Project's efforts to improve library investment in digital collections through better data gathering and analysis. The project evaluates methods for collecting e-resource usage data, develops a cost/benefit model for librarians, and explores how data from SFX can enhance insights into user behavior—particularly in regards to full-text journal access. It outlines the various data sources, techniques for analysis, and future possibilities for optimizing usage data.
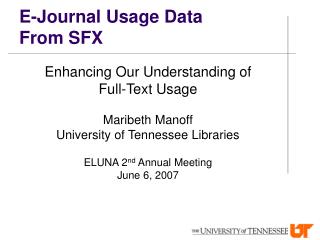

Enhancing Understanding of Full-Text Usage: Insights from SFX Data at UT Libraries
E N D
Presentation Transcript
E-Journal Usage DataFrom SFX Enhancing Our Understanding of Full-Text Usage Maribeth Manoff University of Tennessee Libraries ELUNA 2nd Annual Meeting June 6, 2007
Outline • Background • MaxData Project • UT Libraries and E-Resource Usage Data • Using Data from SFX • Subject Categories • Report 10 (Requests and Clickthroughs by Target) • Other Possibilities
MaxData Project “Maximizing Library Investments in Digital Collections Through Better Data Gathering and Analysis” Funded by Institute of Museum and Library Services (IMLS) 2005-2007 Carol Tenopir, PI
MaxData Project Purpose • Evaluate and compare methods of usage data collection and analysis • Develop cost/benefit model to help librarians select appropriate method(s) for electronic resource usage assessments
MaxData Project Teams • Carol Tenopir and Donald King: readership surveys at UT and four Ohio Universities • David Nicholas et al. (Ciber): deep log analysis on OhioLINK journal usage data • UT Libraries: COUNTER data from vendors, data from several local systems • Gayle Baker, Electronic Services Coordinator • Eleanor Read, Data Services Librarian • Maribeth Manoff, Systems Librarian
UT Libraries andE-Resource Usage Data • Database or Package Level • “Hits” recorded from database menu pages • COUNTER reports from vendors (e.g. Database Report 1: Total Searches and Sessions by Month and Database) • Federated search system (MetaLib) statistics • Totals from journal-level data
UT Libraries andE-Resource Usage Data • Journal Level • COUNTER reports from vendors (e.g. Journal Report 1: Number of Successful Full-Text Article Requests by Month and Journal) • SFX statistics (e.g. Report 10: Requests and Clickthroughs by Journal and Target) • Some libraries using proxy server logs
UT Libraries andE-Resource Usage Data • What do we want to know from the data? • We want insights into user behavior, e.g. which e-journals they are using and how they are getting to full-text • We want to use these insights to make collection management decisions and to improve access
UT Libraries andE-Resource Usage Data • Which data are more or less useful in answering the questions? • The good news and the bad news - all the data we’ve looked at thus far has potential.
UT Libraries andE-Resource Usage Data • Next steps in determining costs and benefits for the model: • Survey of librarians who collect and work with usage data from vendors • Gathering a variety of data sets and views for analysis and presentation – here is where SFX data comes in
Using Data from SFXThe Starting Point • Journal level analysis thus far has been done using a spreadsheet combining JR1 Reports for 30+ vendors • Using Sep-Nov 2005 time period to correspond with MaxData readership surveys • Using data from SFX to complement and supplement COUNTER vendor reports
Using Data from SFXSubject Categories • In order for journal level data to be useful to collection managers at UT, we need a way to present data by subject area • Journals assigned to subject categories in SFX – just what we need except that the categories are too granular for our purpose
Using Data from SFXSubject Categories • Exported global list of categories from SFX • Mapped these to a set of local categories • Used SFX export query to create a listing of journals with subjects • Matching on ISSN, added subjects to combined JR1 spreadsheet
Using Data from SFXReport 10 • “Requests and clickthroughs by journal and target” • On the SFX Menu • Electronic full text is available in Journal A, Package Y and Z – “Request” statistic recorded for each • Student chooses link to Journal A in Package Y – “Clickthrough” statistic recorded
Using Data from SFXReport 10 • Data elements corresponding to COUNTER JR1 report: • ISSN, Title, SFX Target – JR1 Platform • SFX Clickthrough – JR1 Full Text Request • Look at these two numbers alongside each other to see a fuller picture of use • Compare trends and patterns • See data not in JR1 reports, e.g., non-COUNTER packages, open access journals, backfiles
Using Data from SFXReport 10 • Viewing Report 10 alongside JR1 requires reformatting • Possible to do this with a manual or programming approach, depending on time and expertise available • Looking forward to • Change to format of SFX Query • Automated load of both data sets into an ERMS
Using Data from SFXOther Possibilities • Report 2: Number of requests and clickthroughs per source • Report 16: Unused full text journals • In actuality, the possibilities are endless! • I would love to hear your ideas – thanks!