Understanding Future Colorado River Streamflow Uncertainties
Explore uncertainties in future Colorado River streamflow projections regarding climate change, hydrology models, and land surface representation, derived from the Western Water Assessment report. Learn about the impact of various factors on runoff sensitivity and projections. Discover the significance of model subsets, emission scenarios, and periods of analysis in streamflow forecasts. Gain insights into the sensitivity of spatial resolutions and land surface simulations on runoff changes. Enhance your understanding of hydrology models' responses to temperature and precipitation alterations. Gain valuable insights into the factors influencing Colorado River streamflow projections.

Understanding Future Colorado River Streamflow Uncertainties
E N D
Presentation Transcript
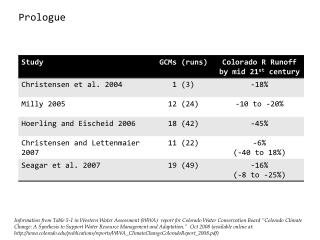
Prologue Information from Table 5-1 in Western Water Assessment (WWA) report for Colorado Water Conservation Board “Colorado Climate Change: A Synthesis to Support Water Resource Management and Adaptation.” Oct 2008 (available online at: http://wwa.colorado.edu/publications/reports/WWA_ClimateChangeColoradoReport_2008.pdf)
Brad Udall Dennis Lettenmaier Julie Vano Dan Cayan Hugo Hidalgo Tapash Das Jonathon Overpeck Holly Hartmann KiyomiMorino + Greg McCabe (USGS) Robin Webb (NOAA) Marty Hoerling (NOAA) Levi Brekke (Reclamation) Kevin Werner (NWS RFC) *RISA: Regional Integrated Science and Assessments
JAN 2014 Understanding Uncertainties in Future Colorado River Streamflow JA Vano and Collaborators Dennis Lettenmeier, (UW, CIG, CIRC) Brad Udall (WWA) Dan Cayan, Tapash Das, Hugo Hidalgo (CAP) Jonathon Overpeck, Holly Hartmann, KiyomiMorino (CLIMAS) Robin Webb, Marty Hoerling (NOAA) Greg McCabe (USGS) Levi Brekke (Reclamation) Kevin Werner (NWS RFC)
GCM CLIMATE RCM Hydrology model LAND SURFACE Stream-flow MGMT IMPACT Adapted from Vano et al 2014: Figure 1
GCM Seager et al. 2007 Seager et al 2013 Milly et al. 2005 boundary conditions CLIMATE RCM Stat. down P-E, R Hydrology model LAND SURFACE P-E, R flow routing Stream-flow MGMT IMPACT Adapted from Vano et al 2014: Figure 1
GCM Seager et al. 2007 Seager et al 2013 Milly et al. 2005 Christensen et al. 2004 Christensen and Lettenmaier 2007 Cayan et al 2010 USBR 2011 boundary conditions CLIMATE RCM Stat. down P-E, R Hydrology model LAND SURFACE P-E, R flow routing Stream-flow MGMT IMPACT Adapted from Vano et al 2014: Figure 1
GCM Seager et al. 2007 Seager et al 2013 Milly et al. 2005 Christensen et al. 2004 Christensen and Lettenmaier 2007 Cayan et al 2010 USBR 2011 Gao et al 2011 Rasmussen et al 2011 Gao et al 2012 boundary conditions CLIMATE RCM Stat. down P-E, R Hydrology model LAND SURFACE P-E, R flow routing Stream-flow MGMT IMPACT Adapted from Vano et al 2014: Figure 1
GCM, Emission Scenario • & Period of Analysis • Spatial scale • Land Surface models • Statistical Downscaling
Uncertainty #1: GCM, Emission Scenario & Period of Analysis GCM RCM CLIMATE Hydrology model LAND SURFACE Stream-flow MGMT IMPACT
Different GCMs, A1B scenario -19% -13% Adapted from Vano et al 2014: Figure 3
Different GCMs, A1B scenario -19% -13% -24%
Same GCMs, Different Emissions Scenarios -8% -13% -15%
Same GCMs, Different Emissions Scenarios & Different Periods of Analysis -17% -8% -10% -15%
Lesson #1: 1. Model subset size and composition will impact projections of future streamflow. 2. Emission Scenario and Period of Analysis may matter for some model subsets.
Uncertainty #2: GCM Spatial scale. RCM CLIMATE Hydrology model LAND SURFACE Stream- flow MGMT IMPACT
Basin-wide, PRCP amounts are roughly equivalent in summer and winter • BUT • winter PRCP is much greater in headwaters and more efficiently produces runoff.
15 85
0 100 200 300 400 500 600 700 800 900 1000 Runoff (mm/year) Figure from Vano et al., BAMS, January 2014
1/8˚ 2˚ 1/2˚ 1˚ 0 100 200 300 400 500 600 700 800 900 1000 Runoff (mm/year)
1/8˚ 2˚ 1˚ 1/2˚ Annual Average Runoff above Lees Ferry (mm/yr) Grid spacing (degrees) Adapted from Vano et al 2014: Figure 4
Sensitivity: The % change in runoff for an imposed increase in T. Annual Average Runoff above Lees Ferry (mm/yr) Grid spacing (degrees) Adapted from Vano et al 2014: Figure 4
Lesson #2: Coarser spatial resolutions tend to be more sensitive to change from both warming and precipitation reduction.
Uncertainty #3: GCM Land surface representation. RCM CLIMATE Hydrology model LAND SURFACE Stream-flow MGMT IMPACT
Grid-based simulations of land-surface processes using principles of energy and water balance • Daily timesteps with some sub-daily processes • Forcing data: PRCP, T, specific humidity, wind speed, air pressure, and surface incident shortwave and longwave radiation
elasticity* (runoff:prcp) * elasticity is a ratio of: the percent change in annual model runoff to the percent change in annual precipitation. Adapted from Vano et al 2014: Figure 5
sensitivity* (%∆ per deg C) * sensitivity is the percent change in runoff for an imposed increase in T. Adapted from Vano et al 2014: Figure 5
Lesson #3: Hydrology models show: 1. substantial differences in sensitivities to T increases; 2. similar responses to precipitation change; 3. differences in P elasticity and T sensitivity are generally smaller in headwater regions.
Uncertainty #4: GCM Statistical downscaling. RCM CLIMATE Hydrology model LAND SURFACE Stream-flow MGMT IMPACT
1 month 200 km 10-20 km sub-daily
+6% Global Climate Models (A2 emissions scenario)
Lesson #4: The choice of downscaling method can affect the magnitude of the climate signal leading to differences in long-term projected runoff.
Re-cap We identified four major reasons for discrepancies in Colorado River projections: GCMs and emissions scenarios; Spatial scale or the ability of models to simulate the disproportionate contributions to Colorado River discharge of the relatively small, high elevation runoff source areas; Sensitivities of land surface hydrology models to P and T changes; Methods used to statistically downscale GCM scenarios.
Implications for Decision makers • From past AR4 studies, we can say with high likelihood that in the Colorado: • Temperatures (T) will rise in the Colorado over the coming decades • Precipitation (P) less certain, but will likely decline on annual basis • From our analysis • Warmer T (ignoring P) will reduce runoff production (our estimates -6.5 3.5% per C at Lees Ferry) • Change in P results in streamflow response of 2 to 3 times (5% decline in P results in 10-15% decline in streamflow) • Coarse spatial resolution of models does not resolve high elevation hydrologic processes that dominate Colorado River basin runoff production
Parting words… The diversity of approaches to projecting future streamflow in the scientific literature requires further analysis to make apples-to-apples comparisons in order to better understand sources of uncertainty.
The Uncertainty Prayer* Grant us…The ability to reduce the uncertainties we can;The willingness to work with the uncertainties we cannot;And the scientific knowledge to know the difference. - Thank you! Research funded by NOAA through its RISA (Regional Integrated Sciences & Assessments) Project and its National Integrated Drought Information System *http://www.wucaonline.org/assets/pdf/actions_whitepaper_120909.pdf
Summary • 14 co-authors, from academia and federal agencies, many authors of divergent papers • Reached agreement on four key sources of future uncertainties AND important certainties for decision makers in the Colorado River basin • Documented for the larger science and management communities how to approach seemingly disparate results, particularly timely with new results being released with the 5th Assessment Report (AR5)
Future research directions • Where research evolving (not ranking of research priorities): • New climate change projections • Increased spatial resolution of climate models • Improved land surface simulations • New paleoclimate reconstruction and model evaluation • Improved observational records • Strengthening connection with management community As climate science evolves, understandings will improve. However, there will be no single magic bullet. Therefore, a continued effort to communicate and incorporate uncertainty is needed.