Download
1 / 22
220 likes | 336 Vues
MANTRA balloon FTIR measurements of stratospheric species at mid-latitude summertime: comparisons with the Canadian Middle Atmospheric Model. S. M. L. Melo, CSA, Canada C. McLandress, P. Fogal, T. Shepherd, and K. Strong Department of Physics, University of Toronto, Canada

E N D
MANTRA balloon FTIR measurements of stratospheric species at mid-latitude summertime: comparisons with the Canadian Middle Atmospheric Model S. M. L. Melo, CSA, Canada C. McLandress, P. Fogal, T. Shepherd, and K. Strong Department of Physics, University of Toronto, Canada Jack McConnel, Kirill Semeniuk, York University Jonathan Davies, Environment Canada R. Blatherwick, Department of Physics, University of Denver, USA
How well do we know what controls mid-latitude stratospheric ozone? S. M. L. Melo, CSA, Canada C. McLandress, P. Fogal, T. Shepherd, and K. Strong Department of Physics, University of Toronto, Canada Jack McConnel, Kirill Semeniuk, York University Jonathan Davies, Environment Canada R. Blatherwick, Department of Physics, University of Denver, USA
Outline: • - Ozone budget at mid-latitudes • - MANTRA • Justification for using CMAM • Long-lived species • O3 and T • Discussions
IPCC – Special Report on Ozone and Climate, 2005 O3, like water vapour and CO2, is an important and naturally occurring greenhouse gas At the same time, changes in climate could impact O3 in a number of different ways. - any changes in O3 abundance could have an impact on climate.
IPCC – Special Report on Ozone and Climate, 2005 • Globally, O3 has decreased by roughly 3% since 1980; • Currently, there is no unequivocal evidence from measurements in the atmosphere that the onset of O3recovery has begun; • Recovery of O3 layer is a complex issue: it depends not just on the extent to which the ODSs are replaced but also on emission of gases that impact the climate system directly; • Stratospheric O3 depletion has lead to a cooling of the stratosphere (over mid-latitude ~ 0.6K/decade); • Future temperature changes in the stratosphere could either enhance or reduce stratospheric O3 depletion, depending on the region; • O3 abundance in the Northern Hemisphere mid-latitudes and Arctic is particularly sensitive to dynamical effects (transport and temperature); • Statistical and modelling studies suggest that changes in stratospheric circulation regimes can have an impact on surface climate patterns;
Total ozone deviations w.r.t. 1964-80 average, adjusted for seasonal effects and smoothed (1964-2001). Global mean total column ozone for 1997-2001 was ~3% below the 1964-1980 average NH decrease is ~3% SH decrease is ~6% 35-60°N 35-60°S Mid-Latitude Ozone Trends WMO Ozone Assessment 2002, adapted from Fioletov et al. (JGR 2002)
Ozone vertical profile trends SAGE I+II sondes Range of model results at 40-45 km • uncertainties in T, CH4 trends Underestimate NH trends at 10-25 km • uncertainties in H2O trends, bromine, vortex chemistry and mixing, role of dynamics WMO Ozone Assessment 2002
Mid-Latitude Ozone Loss • In contrast with the polar ozone destruction, which is attributed to anthropogenic emissions of CFCs, the origin of mid-latitude ozone decline still remains an open question. • Proposed mechanisms: • In situ chemistry, involving heterogeneous reactions on aerosols/clouds, • Changes in the intensity of the Brewer-Dobson circulation leading to an effect on diabatic descent, • Transport of ozone-poor air or and PSC-activated air from the polar vortex toward mid-latitudes. • Marchand et al., JGR 2003 : model analysis – estimates total polar air contribution is usually between 20% and 40% of the total O3 loss (45N-50N). Can be as much as 50% during large vortex intrusions.
The MANTRA Campaigns • Balloon mission to study the changing chemical balance of the mid-latitude stratosphere; • Supported by the Canadian Space Agency and the Meteorological Service of Canada (all flights), CRESTech (1998), NSERC (2002, 2004); • Science Team from U of Toronto, MSC, York U, U of Waterloo, U of Denver, CNRS Service d’Aéronomie, Scientific Instrumentation Ltd.; • Four campaigns conducted at Vanscoy, SK (52N, 107W);
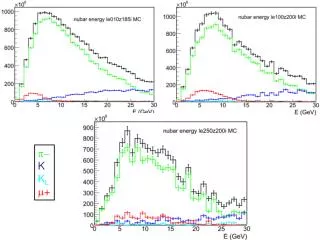
Instruments of interest here: balloon-based SPS, SAOZ, and DU-FTS, the ground-based UT Spectrometer; and the sondes. • In this work we report on vertical profiles of T, O3, NO2, N2O, CH4, and HCl concentrations . • Campaigns: 1998, 2000, 2002, and 2004
Canadian Middle Atmosphere Model (CMAM) is a spectral General Circulation Model (GCM) Using CMAM profiles output at the grid point closest to Vanscoy: to complement the MANTRA measurements; to compare correlations of long-lived species (indicators of transport); to validate representation of processes in CMAM; to test assumptions about variability of species, and the extent to which some can be constrained from knowledge of others; MANTRA – CMAM
Late summer Comparison of NCEP/NCAR (1970-2001), UKMO (1993-2002) and CMAM (24 years) long-term means of zonal wind velocity over Vanscoy. • The green curve is NCEP/NCAR data; • Blue is UKMO; • Red is CMAM (WMO). • Taken from Wunch et al., A-O in press.
MANTRA – CMAM: T (sondes) 10-20 km: the averaged temperature profiles agree with the model within 2% . - within the model inter-annual variability. • CMAM: • Below 14 km: • cold bias (2 – 6 km); • Above: warm bias;
MANTRA – CMAM: O3 (Sondes) • Measurements: • - consistent in 2002 • depletion in the peak alt. 1998 CMAM: 10-20 km: positive bias ? - within the variability
- Local O3 loss: • HCl heterogeneous chemistry – on top of clouds? • HCl + ClONO2 -> Cl2 + HNO3 • HCl + HOCl -> Cl2 + H2O • H2O + ClONO2 -> HOCl + HNO3 • HCl + HOBr -> H2O + BrCl • requires cirrus clouds or cold aerosols – at 25 km? Non-polar latitudes: proposed by Hofmann and Solomon, 1989 - Smith et al, 2001 has shown evidence that this would not be the case!
Arctic vortex processed air? • - Hess and Holton, 1985: remains of polar vortex could persist a long time as "frozen" in the mean summertime flow; • Evidence shown by Newman et al., 1996 (ER-2 dataset); • Orsolini, 2001: chemical transport model – predict that some "fossil" of polar vortex subsist even in August in stratosphere; • Durry and Hauchecorne, 2005 present evidence: CH4 and H2O measurements. Orsolini, GRL, 2001
Summary • Objective: • Analyze MANTA dataset in terms of O3 chemistry at mid-latitudes; • Use CMAM to complement measurements; • Results: • measurements indicating that the adoption of a lower vertical eddy diffusion coefficient improved model; • O3 and T: measurements and model in general agreement; • lower levels of HCl measured in 1998 may be linked to depletion of O3 in the peak altitude region: fossil from Arctic vortex? • Paper drafted and now under revision – still work in progress! THANKS!