
Case 1 – Reactor Design
Case 1 – Reactor Design. Choose main conditions – Pressure, cycle length, type feed, product, flowrate Catalyst volume Optimum mass flux is set at 2,7 – 3 kg/s/m2 Normal pressure drop per bed not higher 3-3,5 bar Set maximum catalyst bed length – 10-12 m Set a maximum catalyst bed exotherm

Case 1 – Reactor Design
E N D
Presentation Transcript
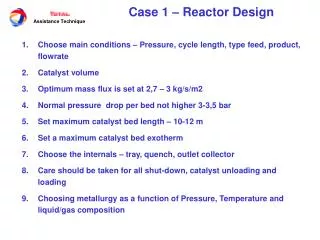
Case 1 – Reactor Design • Choose main conditions – Pressure, cycle length, type feed, product, flowrate • Catalyst volume • Optimum mass flux is set at 2,7 – 3 kg/s/m2 • Normal pressure drop per bed not higher 3-3,5 bar • Set maximum catalyst bed length – 10-12 m • Set a maximum catalyst bed exotherm • Choose the internals – tray, quench, outlet collector • Care should be taken for all shut-down, catalyst unloading and loading • Choosing metallurgy as a function of Pressure, Temperature and liquid/gas composition
Case 2 – Unit Poor Performances 400 390 380 370 360 normalised temperature (°C) 350 340 330 320 0 60 120 180 240 300 360 cycle length (days) Case 2A - Unit A in France had an apparent activity at 25°C higher than expected HDS - Evolution of normalised temperature for operating conditions feed sulphur = 5000 wppm, product sulphur = 200 wppm, LHSV = 1,6 h-1 Actual performances Expected performances
Case 2 – Unit Poor Performances Cause analysis a. Sampling and analysis validity! b. Bad H2S stripping – H2S recombination c. Leak or by-pass on a start-up line or a P measurement line d. Feed-Effluent exchanger leak e. Impurities in gaz phase f. Mal distribution g. Poor catalyst performances
Case 2 – Unit Poor Performances Effluent at 10 wtppm S Effluent at 50 wtppm S Effluent at 350 wtppm S • Leak or by-pass confirmation • Kinetic analysis - Use of chemical tracers • Pressure drop variation - Use radioactive tracers Feed containing 3500 wtppm S 390 380 370 360 Required temperature to reach specification (°C) 350 340 330 320 0,0 0,2 0,4 0,6 0,8 1,0 1,2 1,4 1,6 Leak %
Case 2 – Unit Poor Performances Effluent 28 ppm Effluent + 1%charge C3 BT DBT 4,6 DMDBT Feed-effluent exchanger leak - feed effluent analysis Sulphur compounds specific chromatograph
Case 2 – Unit Poor Performances Seff éch A 3 four A B Scharge 1 échangeur Seff réacteur 2 Seff éch B 4