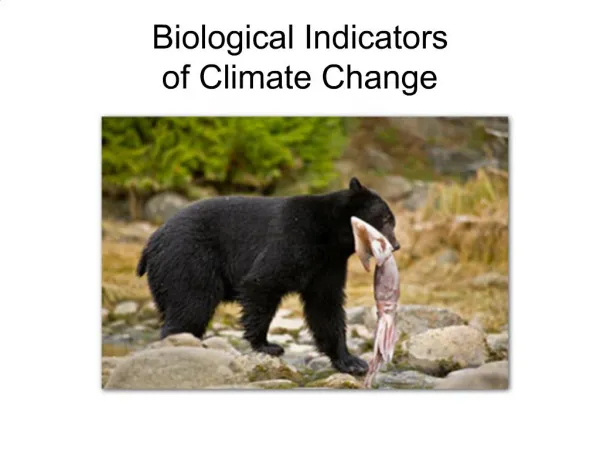
Biological Indicators Across Heterogeneous Datasets for Ocean Monitoring
310 likes | 445 Vues
This document discusses the use and selection of ecological indicators within the framework of the Marine Strategy Framework Directive (MSFD). It highlights the importance of biological indicators, such as the Continuous Plankton Recorder (CPR), which offers extensive monitoring of plankton biodiversity over nearly a century. The presentation emphasizes adaptive management, the significance of natural variability, and how different indicators measure progress toward achieving Good Environmental Status (GEnS). It also addresses challenges related to spatio-temporal representativity and the integration of heterogeneous datasets for effective environmental policy.

Biological Indicators Across Heterogeneous Datasets for Ocean Monitoring
E N D
Presentation Transcript
Biological indicators across heterogenous datasets Abigail McQuatters-Gollop
Outline • Ecological indicator use and selection • Indicators in the context of the MSFD • Examples of applied ecological indicators
The Continuous Plankton Recorder (CPR) • Plankton ecologically important • Unchanged methodology (80 years) • Longest, most spatially extensive oceanic monitoring program in the world • ~ 1 million samples • 500 plankton taxa + indicator of phyto biomass • Microplastics • Water sampler
An indicator approach Edwards, M. et al (2010) TREE
Determining indicators • Policy relevance • Spatio-temporal representivity • Data
DATE 15.7.10 15.7.11 15.7.12 by 2013 15.7.14 by 2014 by 2015 by 2016 by 2019 2020 Marine Strategy Framework Directive Objective: to achieve Good Environmental Status (GEnS) of Europe’s seas by 2020 • Regional seas approach to Ecosystem Based Management • Adaptive management • Consistency and comparability in monitoring programmes • Importance of natural variability • 11 qualitative descriptors of GEnS
DATE 15.7.10 15.7.11 15.7.12 by 2013 15.7.14 by 2014 by 2015 by 2016 by 2019 2020 Descriptors of GEnS • Biodiversity • Non-indigenous species • Fisheries • Marine food webs • Eutrophication • Benthic ecosystems • Hydrographical conditions • Pollution • Contaminants • Marine litter • Energy and noise Milestones • Initial assessment • Determination of GEnS • Establishment environmental targets & associated indicators Programme of measures to achieve or maintain GEnS Entry into operation of the programme of measures Establish and implement monitoring programme Criteria and methodological standards decided Achieve GEnS DATE 2010 2012 2014 by 2015 by 2016 2020 nowSeas EVA ROTH &TIM O’HIGGINS
Indicators in MSFD • Used to monitor towards environmental targets/GEnS • Descriptors -> criteria -> indicator(s) • One criterion – multiple indicators • One indicator – multiple measures MSFD Descriptor Eutrophication Criteria for GEnS Criteria for GEnS Criteria for GEnS Water transparency Chlorophyllconcentration Algal spp. shift Indicator Indicator Indicator Secchi depth Phytop. Colour Index Diatom: dino
One criterion – multiple indicators Eutrophication Algal spp. shift HABs Diatom: dino
One indicator – multiple measures Eutrophication Chlorophyllconcentration Chl indicators Phytoplankton Colour Index North Atlantic
Representivity: An issue of scale Edwards, M. et al (2010) TREE
Representivity: An issue of scale • Spatial: Many time-series are localized • Temporal: Many time-series are short Edwards, M. et al (2010) TREE
Data Policy issue • MSFD flexible -> heterogenous datasets (measures) for indicators • Broadly applicable approach • Best use of available data Indicator Dataset 1 Dataset 2
Indicators from heterogenous datasets ICES CPR 1902 - 1912 1948 - present • many methods of sample collection • varying depths • inconsistent taxonomic resolution • inconsistent measures (#, p/a, rr) • patchy seasonal coverage • consistent methodology • consistent tow depth • consistent taxonomic resolution • consistent measures • monthly tow frequency
CPR No. samples ICES CPR ICES 13,000 ~1M Total in DB Comparable study areas 97,093 9,191 Comparable depths 2,619 Comparable seasonality 32,454
Taxonomic challenges • Differences in measures • Differences in taxonomic detail ICES CPR No. taxa 1824 ~500 No. species 1395 ~300 2 Chaetoceros 51 Not spp. Foraminfera 87
Taxonomic challenges • Species name changes/ synonyms
Taxonomic challenges • Taxonomic identification
HABs - Noctiluca ICES 1900s CPR 1980s CPR 1990s CPR 2000s
Climate change – C. hyperboreous ICES 1900s CPR 1960s CPR 1970s CPR 1990s CPR 1980s CPR 2000s
Ocean acidification McQ-G, Edwards, Beaugrand SAHFOS
Eutrophication A. McQuatters-Gollop, M. Edwards
SeaWiFS+CPR = new dataset! SeaWiFS – Chl-a CPR - PCI McQuatters-Gollop L&O
Biogeographical shifts G. Beaugrand
Diversity (simple) Number of dinoflagellate species per sample
Biodiversity (Complex) G. Beaugrand & M. Edwards PNAS (bottom) & GCB (top)
May Taxa not in CPR DB Community changes Taxa not in ICES DB
Consider.... • Policy relevance • Appropriateness of scale • Synchronize heterogenous datasets • Validation / verification