Download
1 / 27
280 likes | 485 Vues
Breakdown & Aging: Modeling & Measurements Ying Sun, JoAnne Ronzello , Steven Boggs University of Connecticut ONR Capacitor Materials Program Review. March 7, 2012. Characterization. Breakdown Measurements. Manual breakdown test for prototype samples. Automated Breakdown Tester.

E N D
Breakdown & Aging: Modeling & Measurements Ying Sun, JoAnne Ronzello, Steven Boggs University of Connecticut ONR Capacitor Materials Program Review March 7, 2012
Characterization Breakdown Measurements Manual breakdown test for prototype samples
Automated Breakdown Tester 598 breakdowns on BOPP carried out unattended Automated breakdown tester for roll film Modifications underway for high field aging
High Temperature Breakdown Heated stage for breakdown as a function of temperature
Dielectric Spectroscopy Time Domain Dielectric Spectrometer: -70 to +300 oC 1 mHz to 10 kHz in minutes 0.1 mHz to 10 kHz in a couple of hours
Discharge Energy Density High voltage switch for discharge energy density measurement 0-8 kV, 0-5 kA, turn-on in ~150 ns
End Connection Tester Good End Connection End Connection Tester capable of generating up to 4 kA peak current in a resonant LC discharge. Discharge near peak current indicates a poor end connection. Bad End Connection
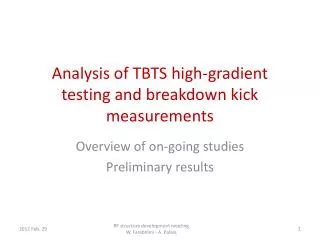
High Field Aging and Breakdown • Short term “DC” breakdown field during a ramp voltage (~500 V/s) is used as a metric of film quality, about 650 MV/m for BOPP at 100 cm2. • On a time scale of 10 minutes and area of 100 cm2, the breakdown field of BOPP is ~480 MV/m. • The difference is presumably the result of high energy electron-induced bond scission, formation of carbonyl, and local increase in conductivity resulting in feedback. • In reality, capacitor energy density is limited by high field aging rather than breakdown. • High field aging limits “Time at Charge” as well as “Life”
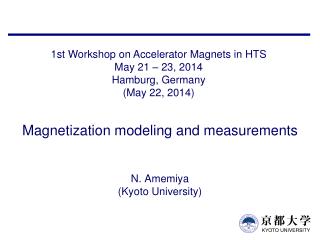
Average Conductivity @ Breakdown ~4x10-12 S/m for Tenter BOPP Integrated Resistive Current (C)
Average vs. Local Conductivity Source: Dr. Janet Ho, ARL
We only measure “average” conductivity • Breakdown is the result of the worst case local conductivity, including statistical effects of worst case morphology over a large active area. • Area: ~1 m2, Statistical independence: 10-10 m2, need worst case morphology at ~10-10 probability. • High field aging is related to local conductivity, and high field breakdown is related to positive feedback from the local conductivity. • We have little knowledge of the statistical distribution of local conductivity, but this might be investigated by electrolytic deposition of Cu.
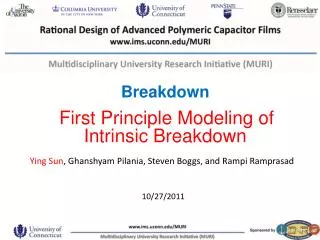
Theory for Breakdown & Aging • Since operating field is the key parameter for energy density, we need a theory for high field aging and breakdown to search efficiently for improved dielectrics. • The steps in this process are: • Theory for intrinsic breakdown • Inclusion of chemical defects (carbonyl, etc.) • Inclusion of morphology and nanocavities • We are presently developing the theory for intrinsic breakdown
First Principles Method of Intrinsic Breakdown • Based on avalanche breakdown, electrons gain energy from electric field and energy lose to phonons. When the net energy gain is no longer balanced by energy loss to the “lattice”, breakdown ensues. • A theory based on an “average electron model” is being tested on well characterized materials prior to addressing polymeric materials.
Average Electron Model • Breakdown occurs when the average energy-gain rate from the • electric field exceeds the energy-loss rate to phonons. • > • Electron phonon scattering rate and average energy loss can be expressed as: • E: electric field • m*: effective electron mass • tk: mean time between scattering • wph: average phonon frequency • gl: loss relaxation frequency • Wi,j,a: the probability an electron in state i being scattered to state j by phonon mode a • e: electron energy • N(ei): density of states • ± corresponds to phonon absorb and emission Total Scattering Rate Total Average Energy Loss
Electron-Phonon Coupling Matrix • dVa: change in potential from atomic displacements of phonon mode a • m: the total mass of the unit cell • na: the phonon occupation number (from Bose-Einstein distribution) • εi: the single particle energy of initial state iand εj the single particle energy of final state j. • q: the phonon wave vector that connects states i and j Electron-phonon coupling matrix is computed from Quantum ESPRESSO, which calculates phonon frequencies using DFPT and also calculates the electron-phonon coupling matrix elements. Modifications of the Quantum ESPRESSO code were necessary to calculate the scattering rate and energy loss rate of insulating materials. Breakdown Criterion Total Scattering Rate Total Average Energy Loss Effective Electron Mass
Effective Electron Mass • Electrons behave like free particles with an effective mass that differs from their vacuum mass. • We use effective electron mass at conduction band minimum for our estimation, which introduces some error. Equation for effective electron mass holds only at CBM
Correlations with Scattering Rate Total Scattering Rate • Larger Scattering rate may caused by greater density.
Correlation with Energy Loss Total Average Energy Loss
Preliminary Calculation Result for Crystalline PE • Effective electron mass is 1 m0 for simplicity. • Breakdown criterion, energy gain value is greater than energy loss value in the entire electron energy range. • Calculated breakdown field of crystalline PE: 11 x 109V/m.
Preliminary Calculations for Crystalline PE • Preliminary calculation for crystalline PE gives 11x109V/m, while the experimental value for technical PE is ~1.6x10⁸V/m. • Lack breakdown data for pure crystalline polyethylene. • Chemical impurities in polyethylene, such as carbonyl, reduces the useful band gap.
Initiatives Underway • Computation of intrinsic breakdown for ionic crystals • Computation of intrinsic breakdown based on integration over the electron energy distribution • Computation of crystalline PE intrinsic breakdown including carbonyl
Future Directions – Engineering Breakdown • Introduction of density fluctuations, semicrystalline morphology, and “defects” • Estimation of worst case “path” over a large area (extreme value statistics) • High field aging as a function of nanocavities, density fluctuations, worst case path, and average field • Breakdown as a result of high field aging-induced positive feedback to conductivity • Publications: Y. Sun, S. Boggs, R. Ramprasad, “ First Principles Calculations of Intrinsic Breakdown in Covalently Bonded Crystals”, Submitted for 2012 IEEE International Symposium on Electrical Insulation.