Download
1 / 22
220 likes | 369 Vues
(Re)Counting the poor in Peru: a multidimensional approach. Juan F. Castro Jessica Baca Juan P. Ocampo Economics Department Universidad del Pacifico November, 2010. Outline. Motivation and objectives. Alkire-Foster dual cut-off method. A simple comparison framework/strategy.

E N D
(Re)Counting the poor in Peru: a multidimensional approach Juan F. Castro Jessica Baca Juan P. Ocampo Economics Department Universidad del Pacifico November, 2010
Outline • Motivation and objectives. • Alkire-Foster dual cut-off method. • A simple comparison framework/strategy. • What is poor in Peru? >> select dimensions and indicators. • Who is poor in Peru? >> apply comparison strategy. • Poverty and policy >> multidimensional poverty incidence across regions and its main contributors. • Concluding remarks.
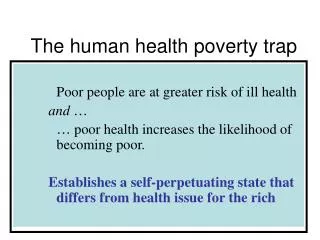
Motivation • Impressive 12 point reduction in Peruvian monetary poverty figures: 48.6% (2004) - 36.2% (2008). Figures mask deprivation in several aspects critical for human development? • We have an extremely rich living-standards survey but multidimensional poverty measurement is a rather unexplored topic in Peru. • Recent work by Alkire and Foster on multidimensional poverty, providing a simple yet insightful approach for identifying the poor.
Objectives • Address the potential controversy between the recent evolution of poverty figures and the levels of deprivation of the Peruvian population. • We use the Alkire-Foster multidimensional headcount for a formal approach. • We develop a comparison framework. • Illustrate how the multidimensional measure proposed can aid policy design by providing correct incentives to focalize interventions. • We make inter and intraregional comparisons of the aggregate poverty measure and its main contributors.
Alkire-Foster dual cut-off method • Poverty measurement: identification (who is poor?) & aggregation (how many are poor?) • Dual cut-off identification method: • Given n individuals, d dimensions, and a cut-off value for each dimension, identify those dimensions in which each individual is deprived. • Count the number of deprivations for each individual and identify as “poor” those whose number of deprivations equals or exceeds a specific cut-off value (k).
Alkire-Foster dual cut-off method • Aggregation: family of poverty measures associated with those of the FGT class. We will work with the multidimensional poverty headcount (H). • Identification method has desirable properties… • Poverty focused: result provided by the identification function does not vary if a non-poor person increases an achievement. • Deprivation focused: increases in non-deprived dimensions do not change poverty status. • We can combine cardinal and ordinal data.
Alkire-Foster dual cut-off method • Important feature: identification occurs before aggregation! • How can we determine who is poor before aggregating across dimensions? start by identifying deprivations and then aggregate to identify the poor. • Unidimensional vs. multidimensional view of poverty: not only the number of dimensions, but also the timing of the aggregation stage monetary poverty lines consider a bundle of goods BUT aggregation within individuals occurs before any meaningful process of identification.
A simple comparison framework • We DO NOT want: a tool to determine if the poverty lineindicator under of overestimates some underlying “true level” of poverty. • We DO want: measure the tension between the incidence of monetary poverty and the overall level of deprivation in terms of the set of attributes considered for the multidimensional measure. • The assets considered: play an important role in human development; are not perfect substitutes nor perfect complements when choosing k, we prefer to stay away from the “intersection” (deprivation in all; k=d) and “union” (deprivation in any of them; k=1) approaches.
H HU A PL B HI k 1 k* d • A simple comparison framework Function H(k) and PL: >> Downward sloping (Hu > Hi) >> Slope will depend on the way in which attributes are distributed among the population. E.g. if access to one of the assets implies access to all of them, the H(k) function will be flat little information is added by another dimension. >> If the PL indicator is one of the dimensions considered, there exists a value of k between 1 and d for which PL and H(k) will intersect.
H HU A PL B HI k 1 k* d • A simple comparison framework >> k* can be informative of the potential tension between the identification as “poor” according to the PL indicator and the overall level of deprivation in the dimensions considered. >> k* d PL tends to understate the overall level of deprivation: large risk of classifying as non-poor individuals that endure considerable deprivation. >> And the slope? What if the H(k) function is almost flat?
H HU A PL B HI k 1 k* d • A simple comparison framework >> Compare A = Hu-PL vs. B = PL-Hi. Large positive difference between A and B: >>Majority of individuals deprived in 1 to d-1 dimensions are able to surpass the monetary poverty line!! >> PL indicator “looses power” to reject the status of “non-poor”: we can be sure that those classified as poor are surely in need; we cannot say that those deemed as non-poor do not suffer considerable deprivation under-coverage problems if social programs are targeted using the PL measure.
What is poor in Peru? • Select a reasonable set of aspects which enjoy of minimum consensus regarding their importance for human development nutrition, education, health, and housing conditions. • Indicators chosen based on: (i) it reflects a relevant achievement within the chosen dimension; (ii) how well does it reflect an asset than we can require social policies to deliver; and (iii) availability of information in a representative household survey.
Who is poor in Peru? 2008 2004 >> The reduction in the level of the PL indicator that has not been accompanied by a similar shift in the H(k) function and, thus, the value of k* has increased. >> The PL indicator now exhibits a larger tendency to understate the overall level of deprivation.
Who is poor in Peru? >> Results provided by the PL indicator have shifted from a tendency to overstate to a tendency to underestimate the overall level of deprivation. >> Contrary to what happened in 2004, more than half of the individuals deprived in 1 to 5 of the dimensions considered are now able to surpass the monetary poverty line. >> If we only rely on the poverty line indicator, we now face a larger risk of classifying as non-poor individuals who still endure considerable deprivation.
Poverty and policy • Poverty measures should convey information regarding the effectiveness of social policies. • The Alkire-Foster identification method has desirable features to track the provision of basic public services. • “Deprivation focused” it creates incentives to provide those assets from which the poor are deprived up to the point of removing such deprivation. • Policymaker would not be able to provoke a significant reduction in the multidimensional headcount ratio unless it focuses on guaranteeing increases in those dimensions in which the poor are deprived.
Poverty and policy >> H(2) indicator provides a less optimistic panorama regarding the incidence of poverty: 21 out of 24 regions shift to a higher poverty group. >> Multidimensional poverty concentrated on Peru’s southern highlands and uncovers significant levels of deprivation affecting the northern Amazon area.
Poverty and policy • Interregional comparison: our multidimensional measure instructs the policy maker to increase its concerns regarding the overall level of deprivation throughout the country. • Which are the main contributors to multidimensional poverty within each region? an intraregional analysis could reveal that the specific focus of these concerns should differ across regions.
Poverty and policy Percentage of multidimensional poor deprived in each dimension >> Not our case! In all regions most of the multidimensional poor are deprived in the dwelling conditions dimensions. >> From these, 74% lack an adequate water service and 52% lack adequate sewage.
Concluding remarks • Recent 12 point reduction in the incidence of monetary poverty has not been accompanied by increased access to other assets important for individuals’ well-being and ability to develop. • We currently face a larger risk of classifying as non-poor individuals who still endure significant deprivation if we only rely on the monetary dimension for identification purposes. • According to 2008 figures, 39% of individuals lacking one third or more of the attributes considered would be classified as non-poor according to the monetary poverty line. This proportion was only 26% in year 2004.
Concluding remarks • The multidimensional headcount used: • Is larger than or equal to the monetary poverty line indicator in all regions. • Uncovers significant deprivation in the northern Amazon. • Reveals that deprivations endured by the multidimensional poor are similar across regions and concentrated on the dwelling conditions dimensions, in particular, on the lack of adequate water and sanitation services opportunity to focalize public investment efforts.
Concluding remarks • Further research: • Use of weights to account for dimensions with different degrees of importance. • Account for education quality via the results of national standardized tests.