

Thermistor Temp. (°C)
E N D
Presentation Transcript
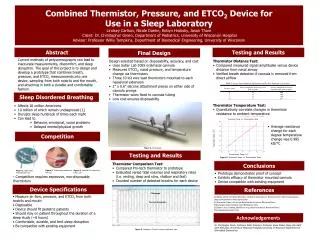
Combined Thermistor, Pressure, and ETCO2 Device for Use in a Sleep LaboratoryLindsey Carlson, Nicole Daehn, Robyn Hrobsky, Jason Tham Client: Dr. Christopher Green, Department of Pediatrics, University of Wisconsin HospitalAdvisor: Professor Willis Tompkins, Department of Biomedical Engineering, University of Wisconsin Figure 2. Thermistors measuring flow [2] Figure 3. Cannula for Pressure & ETCO2 [3] Abstract Testing and Results Final Design Current methods of polysomnography can lead to inaccurate measurements, discomfort, and sleep disruption. The goal of this project is to design and develop a prototype that combines breath, pressure, and ETCO2 measurements into one device, sampling from both nostrils and the mouth, and attaching in both a durable and comfortable fashion. • Design selected based on disposability, accuracy, and cost • Uses Salter Lab 5055 oral/nasal cannula • Measures ETCO2, nasal pressure, and temperature change via thermistors • Three 10 kΩ wire lead thermistors mounted to each nasal/oral extension • 2” x 0.6” silicone attachment pieces on either side of cannula prongs • Thermistor wires fixed to cannula tubing • Low cost ensures disposability • Thermistor Distance Test: • Compared measured signal amplitudes versus device distance from nasal airway • Verified breath detection if cannula is removed from direct airflow Sleep Disordered Breathing Thermistor Temp. vs. Thermometer Temp. • Thermistor Temperature Test: • Quantitatively correlate changes in thermistor resistance to ambient temperature • Affects 18 million Americans • 10 million of which remain undiagnosed [1] • Disrupts sleep hundreds of times each night • Can lead to: • Behavior, emotional, social problems • Delayed mental/physical growth Thermistor Temp. (°C) • Average resistance change for each degree temperature change was 0.995 kΩ/°C Competition Thermometer Temp. (°C) Figure 4. Final design. Testing and Results Figure 6. Thermistor Temp. vs. Thermometer Temp. Conclusions • Thermistor Comparison Test: • Compared Pro-tech thermistor to prototype • Evaluated varied tidal volumes and respiratory rates (i.e. resting, deep and slow, shallow and fast) • Counted number of detected breaths for each device Figure 1. Salter Labs ThermiSense® [3] • Prototype demonstrates proof of concept • Exhibits efficacy of thermistor mounted cannula • Device compatible with existing equipment • Competition requires expensive, non-disposable thermistors Device Specifications • Measure air flow, pressure, and ETCO2 from both nostrils and mouth • Disposable • Device should fit pediatric patients • Should stay on patient throughout the duration of a sleep study (~8 hours) • Comfortable, durable, and limit sleep disruption • Be compatible with existing equipment References Prototype. [1] Dallas Center for Sleep Disorders. Pediatric Sleep Apnea. Retrieved from http://www.dallas-sleep.com/pediatric-sleep-apnea.php[2] Rochester Sleep. Ultra Flow Respiration Monitors. Retrieved from http://www.rochestersleep.com/Respiration.htm[3] Salter Labs. Growing Steadily on a Quality Foundation. Retrieved from http://www.salterlabs.com/ Pro-tech thermistor. Acknowledgements Dr. Christopher Green, Professor Willis Tompkins, Professor Steve Weber, Sleep Lab staff, Amit Nimunkar, University of Wisconsin Hospital, University of Wisconsin-Department of Biomedical Engineering Figure 5. Voltage vs. Time for resting respiratory rate.